Geoscience Reference
In-Depth Information
d=t
c
d>t
c
d<t
c
d
t
c
d
d
t
c
1.5 t
c
t
c
1.5 t
c
d
t
c
CIA
CIA
d
tc
CIA
Time
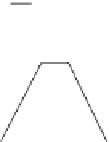
Ty pe 1
Time
Ty pe 2
Time
Ty pe 3
Ty pe 1
- Storm duration,
d
, is equal to the time of concentration, t
c
.
Ty pe 2
- Storm duration,
d
, is greater than the time of concentration, t
c
.
Ty pe 3
- Storm duration,
d
, is less than the time of concentration, t
c
.
FIGURE 25.6
Modified rational method runoff hydrographs.
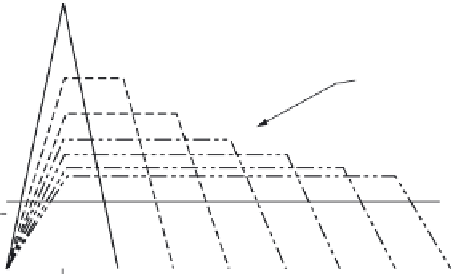
smaller or larger peak rate or discharge, but will produce a greater volume of runoff (area under the
hydrograph) associated with the longer duration of rainfall. Figure 25.7 shows a family of hydro-
graphs representing storms of different durations. The storm duration that generates the greatest
volume of runoff may not necessarily produce the greatest peak rate of discharge.
Note that the duration of the receding limb of the hydrograph is set to equal the time of con-
centration (
t
c
), or 1.5 times
t
c
. The direct solution, which will be discussed later, uses 1.5
t
c
as the
receding limb. This is justified since it is more representative of actual storm and runoff dynamics.
(It is also more similar to the SCS unit hydrograph where the receding limb extends longer than the
risking limb.) Using 1.5 times
t
c
in the direct solution methodology provides for a more conservative
design and will be used in this text.
The modified rational method allows the designer to analyze several different storm durations
to determine the one that requires the greatest storage volume with respect to that allowable release
rate. This storm duration is referred to as the critical storm duration and is used as a basin-sizing
tool. The technique is discussed in more detail in later.
10 year recurrence interval
hydrographs for various rainfall
averaging periods.
25
10
20
20
Rainfall averaging
periods in minutes
15
30
40
50
10
60
70
Allowable Release Rate
5
10
20
30
40
50
60
70
Time (minutes)
FIGURE 25.7
Modified rational method family of runoff hydrographs.


Search WWH ::

Custom Search