Geoscience Reference
In-Depth Information
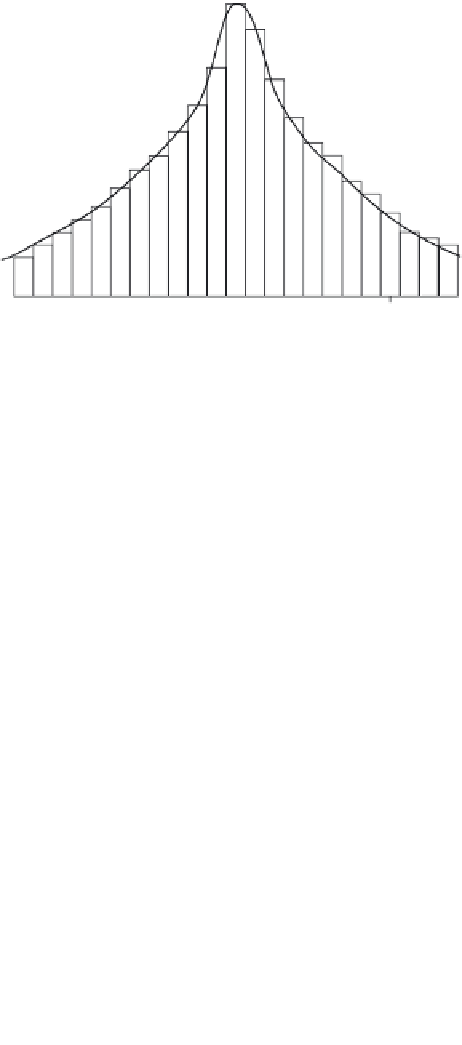
Maximum Rainfall Depth
Next Largest Rainfall
Depth, etc.
0
7
8
9
10
11
12
Time
13
14
15
16
24
FIGURE 25.3
Typical 24-hr rainfall distribution. (From USSCS,
National Engineering Handbook.
Section
5.
Hydraulics
, U.S. Soil Conservation Service, Washington, DC, 1956.)
Figure 25.4 shows the SCS 24-hour rainfall distribution, which is a graph of the fraction of total
rainfall at any given time,
t
. Note that the peak intensity for the Type II distribution occurs between
time
t
= 11.5 hours and
t
= 12.5 hours.
Time in Hours
14
15
16
17
18
19
20
21
22
23
24
1.0
0.9
Type II
0.8
Type I
0.7
0.6
0.5
0.4
0.3
0.2
Type I
0.1
Type II
0
0
1
2
3
4
5
6
7
8
9
10
11
12
13
14
15
Time in Hours
TYPE I - Coastal side of Sierra Nevada and Cascade Mountains in California, Oregon
and Washington; the Hawaiian Islands and Alaska
TYPE II - Remaining United States, Puerto Rico, and Virgin Islands
FIGURE 25.4
SCS 24-hr rainfall distribution. (From USSCS,
Urban Hydrology for Small Watersheds
,
Technical Release No. 55, U.S. Soil Conservation Service, Washington, DC, 1986.)


Search WWH ::

Custom Search