Geoscience Reference
In-Depth Information
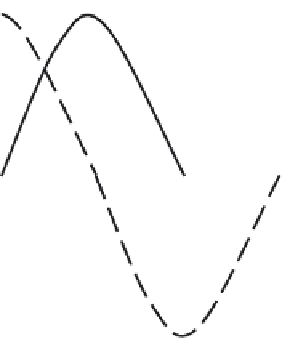
Cosine wave B
Sine wave A
Voltage
+
0
90°
180°
270°
360°
Time
-
FIGURE 11.60
Wave B leads wave A by a phase angle of 90°.
Key Point:
The amount by which one wave leads or lags another is measured in degrees.
To compare phase angles or phases of alternating voltages or currents, it is more convenient to
use vector diagrams corresponding to the voltage and current waveforms. A
vector
is a straight line
used to denote the magnitude and direction of a given quantity. The length of the line drawn to scale
denotes magnitude, and the direction is indicated by the arrow at one end of the line, together with
the angle that the vector makes with a horizontal reference vector.
Note:
In electricity, because different directions really represent time expressed as a phase rela-
tionship, an electrical vector is called a
phasor
. In an AC circuit containing only resistance,
the voltage and current occur at the same time, or are in phase. To indicate this condition by
means of phasors, all that is necessary is to draw the phasors for the voltage and current in
the same direction. The length of the phasor indicates the value of each.
A vector, or phasor, diagram is shown in Figure 11.61, where vector
V
B
is vertical to show the
phase angle of 90° with respect to vector
V
A
, which is the reference. Because lead angles are shown
in the counterclockwise direction from the reference vector,
V
B
leads
V
A
by 9 0 °.
V
B
Counterclockwise
direction
90°
V
Reference phasor
FIGURE 11.61
Phasor diagram.


Search WWH ::

Custom Search