Geoscience Reference
In-Depth Information
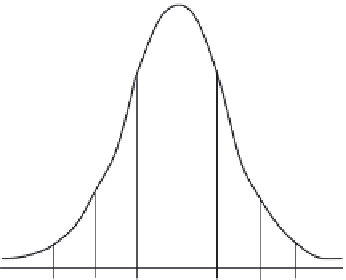
68.26%
95.46%
99.74%
-3
s
-2
s
-
s M
+
s
+2
s
+3
s
FIGURE 7.1
Normal distribution curve showing the frequency of a measurement.
To speak specifically of any normal distribution, two quantities have to be specified: the mean
µ (pronounced “mu”), where the peak of the density occurs, and the standard deviation σ (sigma).
Different values of µ and σ yield different normal density curves and hence different normal distri-
butions. Although there are many normal curves, they all share an important property that allows us
to treat them in a uniform fashion. All normal density curves satisfy the following property, which
is often referred to as the
empirical rule
:
• 68% of the observations fall within 1 standard deviation of the mean; that is, between
µ - σ and µ + σ.
• 95% of the observations fall within 2 standard deviations of the mean; that is, between
µ - 2σ and µ + 2σ.
• 98% of the observations fall within 3 standard deviations of the mean; that is, between
µ - 3σ and µ + 3σ.
Thus, for a normal distribution, almost all values lie within 3 standard deviations of the mean (see
Figure 7.1). It is important to stress that the rule applies to all normal distributions. Also remember
that it applies
only
to normal distributions.
Note:
Before applying the empirical rule it is a good idea to identify the data being described and
the value of the mean and standard deviation. A sketch of a graph summarizing the informa-
tion provided by the empirical rule should also be made.
■
EX AMPLE 7. 3
Problem:
The scores for all high school seniors taking the math section of the Scholastic Aptitude
Test (SAT) in a particular year had a mean of 490 (µ = 490) and a standard deviation of 100 (σ =
100). The distribution of SAT scores is bell shaped.
1. What percentage of seniors scored between 390 and 590 on this SAT test?
2. One student scored 795 on this test. How did this student do compared to the rest of the
scores?
3. A rather exclusive university admits only students who received among the highest 16%
of the scores on this test. What score would a student need on this test to be qualified for
admittance to this university?
The data being described are the math SAT scores for all seniors taking the test in one year. A
bell-shaped curve summarizing the percentages given by the empirical rule is shown in Figure 7.2.


Search WWH ::

Custom Search