Geoscience Reference
In-Depth Information
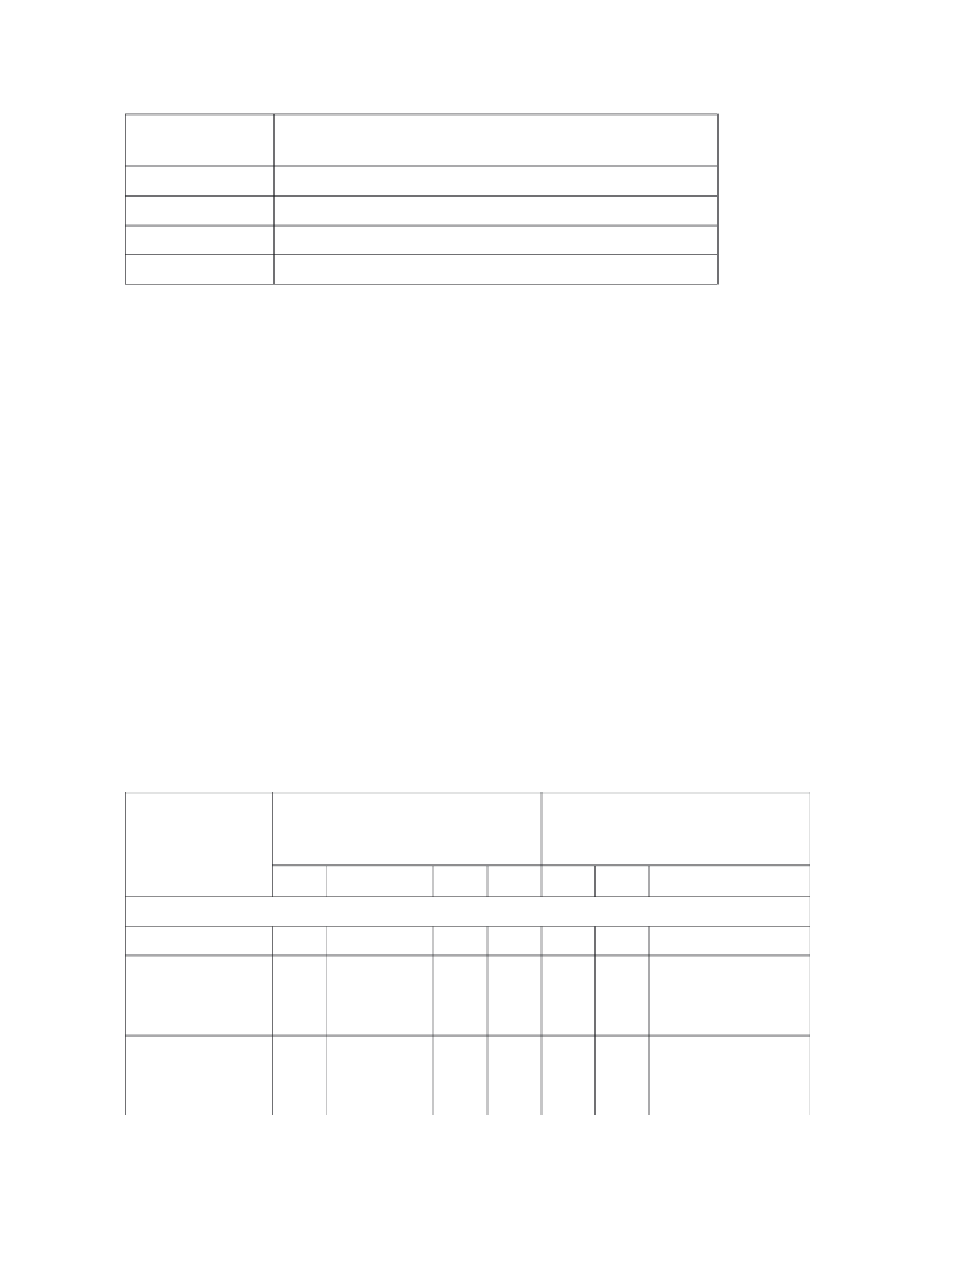
Table 3
Olsen P levels in soils (in milligrams per kilogram)
(Source:
Soil Sense
C-05)
Olsen P levels
Dryland pastures
Irrigated
pastures
Horticultural
low
<8
<15
<20
marginal
8-12
15-20
20-30
moderate
13-18
21-30
31-60
high
>18
>30
>60
Note 1.
Due to the differing buffering capacity of soils, this table is a guide only.
Note 2.
These figures are based on sandy soils. Loams and clays fix more phosphorus than sands but as accurate
predictive methods are only available in New South Wales at present, regular soil testing is recommended on soils
other than sands.
Note 3.
The level of management also needs to be considered; for example, if you are aiming at 10 dse/ha or 25
dse/ha. The nutrient removal from the paddock also needs to be considered when deciding on the amount of
fertiliser to use.
Tissue tests
Tissue tests measure the level of phosphorus in the plant itself, and are a reasonably
accurate method of establishing the phosphorus needs of growing plants at the
time the tissue was collected. If it is found that the plants need more phosphorus
after tissue testing, it would be best applied as a foliar fertiliser.
How much fertiliser is needed?
The range of phosphatic fertilisers available varies in the amounts of phosphorus
they contain (Table 4).
Table 4
Fertilisers containing phosphorus (1997)
N, nitrogen; P, phosphorus; K, potassium; S, sulphur; Ca, calcium. (Source:
Soil Sense
C-05)
Name of
fertiliser (by
company)
Nutrient analysis (%). Applied at
100 kg/ha provides _ kg of
nutrient.
kg of nutrient supplied per tonne
of product
N
P
K
S
Ca
N
P
K
S
Ca
Pivot
Superphosphate
8.8
11.0
88
110
Prolong 15
9.5
15.0
95
150
Super Sulphur
20%
8.1
19.8
81
198
Super Sulphur
35%
7. 0
3 5 . 0
70
3 5 0
G y p Ph o s .
5. 3
11. 8
5 3
118
Search WWH ::

Custom Search