Geoscience Reference
In-Depth Information
the total leakage (discharge Q) through the structure and the corresponding
variance. What value for Q would you suggest to the client?
7 m
7 m
7 m
C
C
C
A
A
A
0 m
0 m
0 m
D
D
D
B
B
B
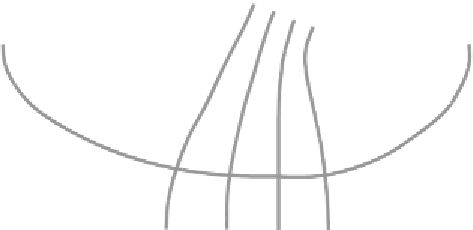
Figure 4.12 Groundwater flow in a coffer dam
application 4.6
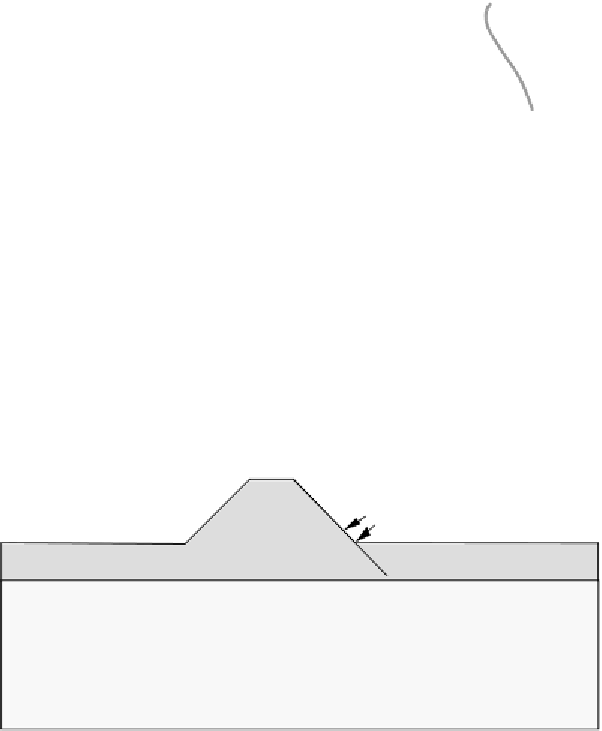
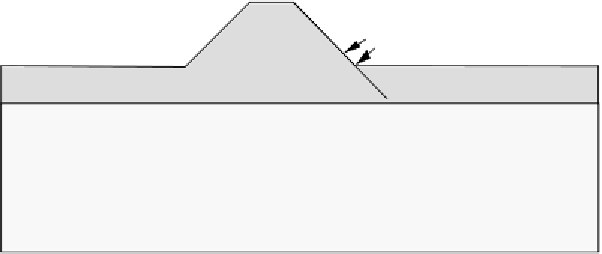
A dike retains a water level of 5m. The soil consists of silty sand. The
permeability of the dike material and the underground is similar:
k
= 1 m/day. The
groundwater table along DC reaches the ground surface. Determine from the
sketched groundwater flow pattern (Fig 4.13) the total leakage (discharge
Q
per m
length of the dike) through the dike and the underground. What is the potential
head along flow line FE (groundwater table), and along seepage face line ED?
If the layer ABCD is peat with identical permeability as silty sand and a wet unit
weight of 11 kPa/m, what will happen in point A? Suggestion: determine the pore
pressure and total vertical stress in point A?
F
F
F
E
E
E
5 m
5 m
5 m
A
A
A
D
D
D
H
H
H
G
G
G
C
C
C
4 m
4 m
4 m
J
J
J
B
B
B
L
L
L
K
K
K
Figure 4.13 Groundwater flow in a dike and underground
application 4.7
A permeability test on sand with wet unit weight 20 kN/m
3
is shown in the Fig
4.14a. Make a graph of the vertical pore pressure and determine the corresponding
vertical effective stress (
w
= 10 kN/m
3
) versus height. The graph is shown in Fig
4.14b. The pressure height in the pipes is 35 cm, yielding actual pore pressure of
0.35 kPa. Total weight equals the height of water and soil, resulting in total stress


Search WWH ::

Custom Search