Geoscience Reference
In-Depth Information
TABLE 2.2b
SPECIFIC (SOLID) GRAVITY
G
S
sand or silt
clay
quartz
2.65
kaolinite
2.65
K-feldspars
2.54 - 2.57
montmorillonite
2.75
Na-Ca-feldspars
2.62 - 2.76
illite (mica)
2.84
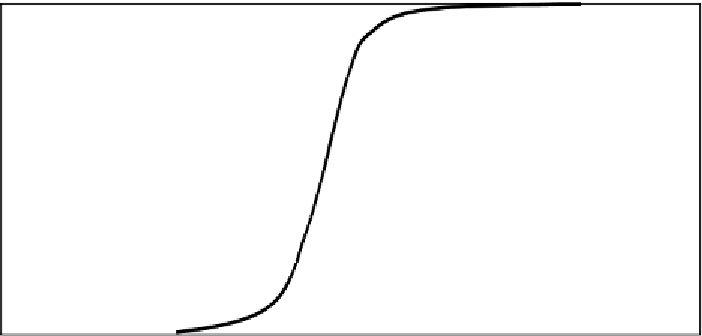
Particle size distribution
A useful method for classification of granular soils is by particle size distribution
obtained by sieving oven-dried (disturbed) soil following a standard procedure.
The amount of material retained in each of the sieves is expressed in a percentage
of the total weight of the original dried sample and represented in a graph on
logarithmic diameter scale. The presentation of a well-graded and a poorly graded
soil by a standard particle size distribution is shown in Fig 2.1.
100
80
poorly graded
standard sieve
60
well graded
silt
sand
40
sand
gravel
20
0
0.01
0.1
1
10
D
D
10
2
0.0625
60
Figure 2.1 Particle grain-size distribution graph (D in mm)
By definition,
D
x
represents the diameter for which x% of the graded material is
less than that diameter. In Fig 2.1,
D
60
of the poorly graded material is 0.25 mm,
and
D
10
is 0.13 mm (i.e. 10% of the grains has a diameter less than 0.13 mm). A
soil is considered uniformly graded when the uniformity coefficient
U = D
60
/D
10
is
less than 2. For the poorly graded material in Fig 2.1,
U
= 0.25/0.13 = 1.92, and
thus uniformly graded. Fines less than 16
m are determined with sedimentation
tests (Hydrometer) after organic material such as peat has been removed.
Internationally accepted soil classification by particle-size ranges is shown in
Table 2.3.
TABLE 2.3
CLASSIFICATION BY PARTICLE SIZE
D
50
fine-graded
clay silt
colloids fine medium coarse
2 6 20 50
m


Search WWH ::

Custom Search