Geoscience Reference
In-Depth Information
The variance in the parameters is estimated: for
C
about 25%, for
h
20%, for
c
m
at least 50% depending on tests applied and monitoring available, for
R
,
D
,
p
and
usually no significant uncertainty, giving a variance in
S
max
of about 100%. If
adjacent aquifers are active, the variance could be more. Therefore, Geertsma's
formula can be used as a first approximation. When exploitation takes place
monitoring of the induced land subsidence is common practice, and the obtained
data is used to calibrate towards a better prediction model.
Retardation effect
Observations show that induced land subsidence starts later than the start of the
exploitation and when the production is stopped it will lag. These periods are
referred to as retardation. It can be described by the following empirical formula,
valid for a sudden constant reservoir pressure drop of
p
S = S
max
(1
exp(
t/T
r
))
(14.17a)
Here,
T
r
is the retardation time. Observation of small reservoirs shows a value
for
T
r
of about one year, but sometimes it is significantly longer, related to the type
of reservoir rock. In case the reservoir depletion is performed with a constant
pressure drop gradient, such that after a production period of
T
p
at abandonment the
total pressure drop is
p
, then the retardation can be found by convolution of
(14.17a), yielding
S =
(
S
max
/
T
p
)
(
r
T
r
(exp(
(
r
t
)
/T
r
)
exp(
t/T
r
))
(14.17b)
with
r = t
if
t
<
T
p
and
r = T
p
if
t
>
T
p
.
Geodetic evaluation
In a geodetic campaign at time
t
i
height differences are measured:
dh
ti
A-B
. These
differences are improved (closed loop control) and converted to actual heights
h
ti
A
and
h
ti
B
by using a unique stable reference benchmark (Fig 14.12a). The collected
heights
h
ti
are called an epoch
t
i
. Commonly epochs are used for subsidence
evaluation. Using all epochs in an integral way provides better noise and error
handling (Houtenbos).
zero state
zero state
reference
reference
h
t1
B
h
t1
B
t
1
t
1
model error
model error
B
B
A
A
h
t1
A-B
h
t1
A-B
t
1
t
1
h
t1-2
B
h
t1-2
B
t
2
t
2
h
t2
A-B
h
t2
A-B
t
2
t
2
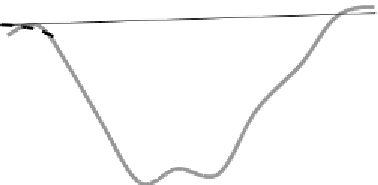
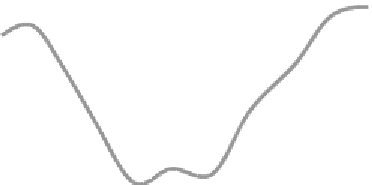
(a) Definition of height and height differences. (b) Incorporation of the model error
Figure 14.12


Search WWH ::

Custom Search