Geoscience Reference
In-Depth Information
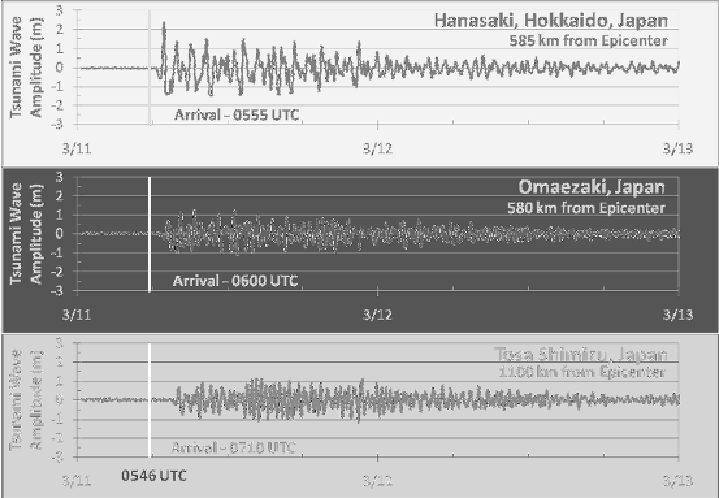
Figure12.Tsunamiwaveheightsandarrivaltimesatthreetidestationsalongthe
JapancoastonMarch11,2011(Source:UNESCO‐IOCsealeveldatafacility)
Although most of the tide gauges in the affected area either lost power or incurred
damage from the tsunami, gauges at a distance along the Japan coast recorded the
wave as it propagated from the source. Figure 12 shows de-tided water level records
for three gauges: one in Hokkaido located north of the event and at Omaezaki and
Tosa Shimizu located to the south. Because of the large displacement zone and the
ocean depth near the Japan Trench, leading depression waves arrived within tens of
minutes at locations over 500 kilometers from the earthquake epicenter. While
Hanasaki, Hokkaido, to the north, is located at the same distance from the epicenter
as Omaezaki, in the south, the first wave arrived at Hanasaki with greater amplitude
and slightly sooner than at Omaezaki. Bathymetric differences between the two
locations as well as the large sea floor displacements north of the epicenter may
explain the differences in wave magnitude and travel time. Significant wave activity
persisted for well over 12 hours at these three Japanese wave gauges.
1.5.3RunupElevationsontheJapaneseCoast
Many of the indicators of the tsunami's paths and overland flows are subtle
demarcations of sand deposits, broken tree limbs or water lines and clean-up efforts
often destroy these perishable data points. Soon after the tsunami, many Japanese
researchers and a few selected international colleagues worked at some personal risk
to conduct detailed surveys of the coastal inundation and runup that occurred. For
their surveys, the field teams defined
runup
(Figure 13) as the elevation above the
Search WWH ::

Custom Search