Geoscience Reference
In-Depth Information
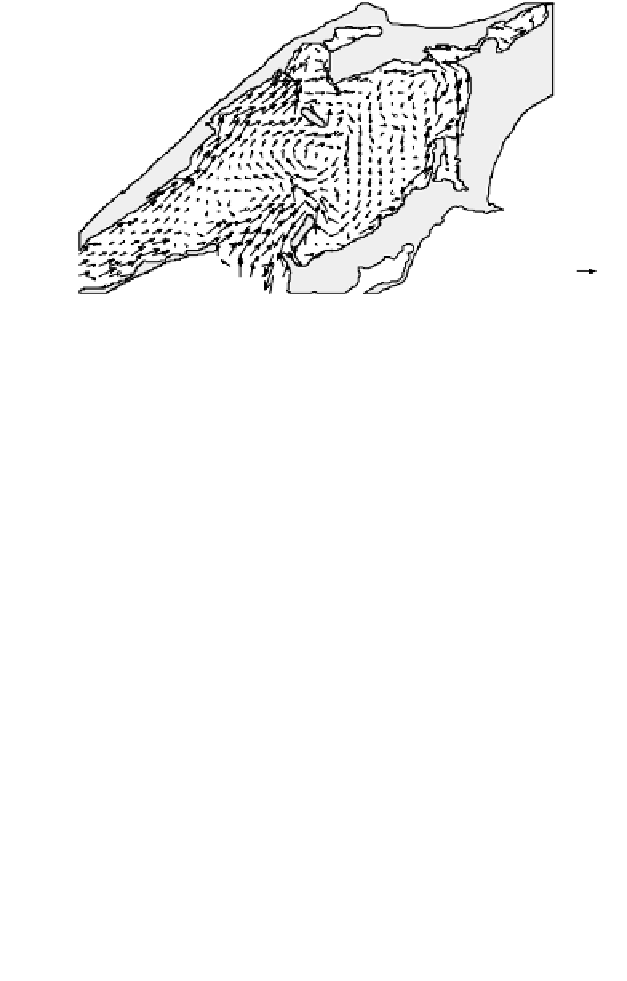
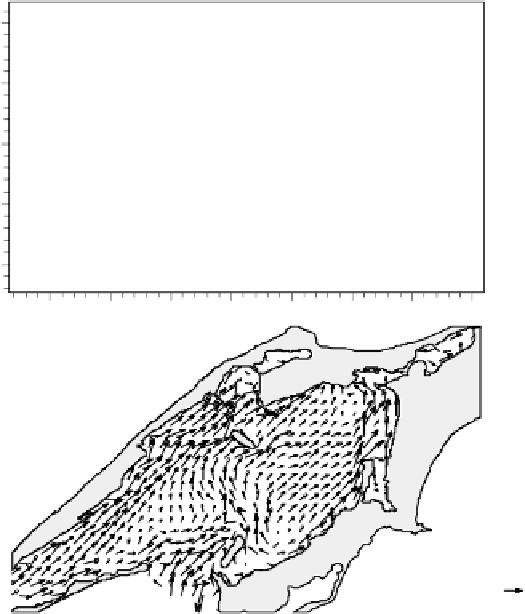
26.0
N
Wind
24.0
22.0
20.0
(A) Mean
currents
18.0
0.1 m/s
26.0
N
Wind
24.0
22.0
20.0
(B) Currents
at 0.75 m
18.0
0.1 m/s
26.0
N
Wind
24.0
22.0
20.0
(C) Currents
at 4.00 m
18.0
0.1 m/s
18
20
22
24
26
28
30
32
km
FIGURE 9.2.5
(A) Simulated vertically averaged current, (B) Surface layer currents (at
0.75 m), and (C) near-bottom currents (at 4 m), under prevailing southwesterly wind conditions
at 13:00 hrs, May 12, 1989.


Search WWH ::

Custom Search