Geoscience Reference
In-Depth Information
Macroalgae
Seagrass
Phytoplankton
Epiphytes
Bottom Light Intensity
Nutrient load
Short Residence Time
Long Residence Time
P
M
P
M
S
S
Low
High
Low
High
Nitrogen loading rates
Nitrogen loading rates
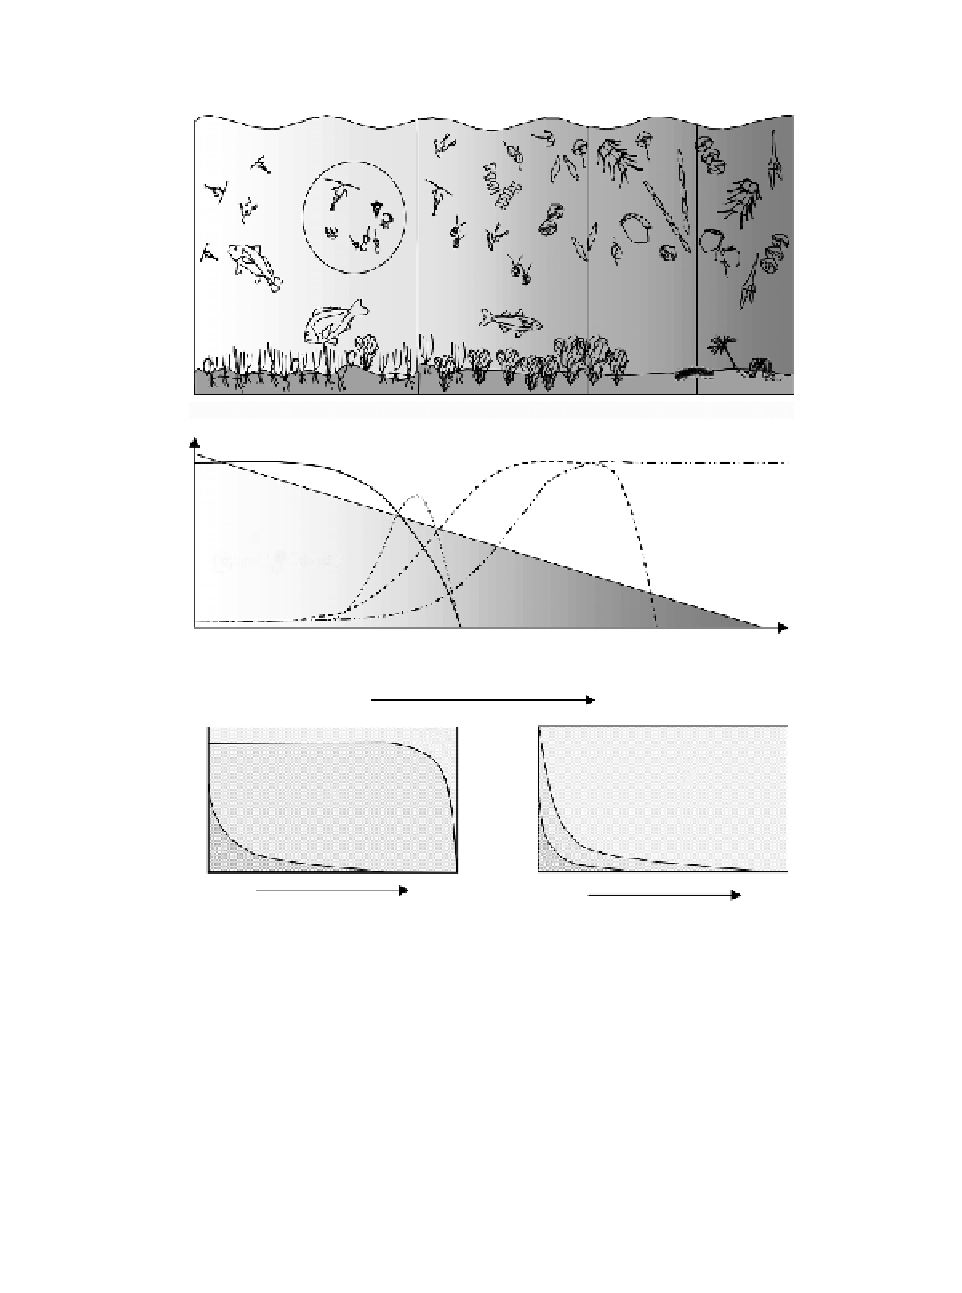
FIGURE 5.2
Representation of changes in the lagoon ecosystem with increasing nutrient
loads. Top: In the oligotrophic state submerged aquatic vegetation is dominated by seagrasses
and the planktonic food web is based on the microbial loop. At moderate nutrient loads—
mesotrophic state—macroalgae outcompete seagrasses and small phytoplankton grow. At high
nutrient loads, large-celled phytoplankton dominates in the water column. Light is strongly
trapped becoming the limiting factor for macroalgae and benthic fauna turns to deposit feeders.
Middle: Evolution of the abundance of submerged aquatic vegetation, epiphytes and phy-
toplankton, with nutrient load and light reaching the bottom. (Adapted from Nienhuis, P.H.,
, 42, 59, 1992. With permission.) Bottom: Relative changes from benthic to pelagic
dominated vegetation with nutrient load and residence time of the water in the lagoon
(S = seagrass; M = macroalgae; P = phytoplankton). (Adapted from Valiela, I. et al.,
Vie Milieu
Limnol
.
Oceanogr
., 42, 1105, 1997. Copyright 1997 by the American Society of Limnology and
Oceanography, Inc. With permission.)


Search WWH ::

Custom Search