Geoscience Reference
In-Depth Information
(Moulton et al. 2000). The middle Palaeozoic
decline in atmospheric CO
2
is corroborated by
studies of palaeosols (e.g. Mora et al. 1996; Driese
& Mora 2001), so there is direct geochemical
evidence supporting the general tenets of the
GEOCARB model. The question of causality
remains to be demonstrated, but the data in its
present form is entirely consistent with the hypoth-
esis that the decline of the acritarchs is a direct con-
sequence of the drop in pCO
2
that occurred as a result
of the terrestrialization process (Strother 2008).
The first step in the assessment of causality is to
test for a correlation between the CO
2
decline and
the acritarch curve. Some form of normalization is
necessary because we are trying to compare two
different things (atmospheric CO
2
concentration
and standing acritarch diversity) whose dynamic
through this interval is tabulated using two different
metrics (rCO
2
and number of taxa). We therefore
normalized the taxon curve by dividing the taxon
value in each bin by its minimum registered value
in the Carboniferous, which was 13 genera. This
linear transformation does not change the shape of
the curve, but it brings the recorded values of acri-
tarch genera into a comparative relative measure
as that of CO
2
that is, essentially a relative taxon
assessment, or rGenus.
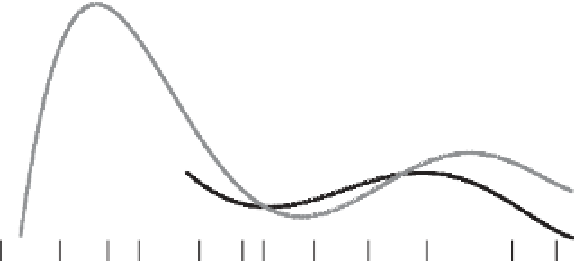
A plot of rCO
2
and rGenus for the entire
Phanaerozoic is shown in Figure 4. The lines on
the graph are the fifth-order polynomial approxi-
mations for each dataset as generated in Excel
w
.
The similarity is quite remarkable, especially given
the independent nature of these two datasets. The
graphs appear to be offset from each other; acritarch
taxon richness appears to lag behind rCO
2
, shifting
progressively from about 40 Ma at the base of
the Cambrian to about 10 Ma in the Mississippian.
We refer to this offset time interval as 1
t
.In
order to examine the possible relation between the
two curves for the terrestrialization interval, we
extracted a subset of the data from 410 Ma to
300 Ma. This corresponds approximately to the
Pragian-Gzhelian interval, which represents the
time during which the effective primary terrestriali-
zation occurred.
To achieve a quantitative sense of how similar
these curves really are, and to assign a value to 1
t
,
we calculated the correlation coefficient between
the two curves and then progressively shifted the
x-axis values of the rGenus data in -10 Ma incre-
ments and recalculated the regression coefficient.
In this way, the highest r value (which provides
the statistically closest correlation) should represent
the best approximation for 1
t
. Table 2 shows the
result of progressively shifting the taxon richness
curve back in time in five 10 Ma increments. The
highest correlation coefficient (r ¼ 0.95) occurs at
1
t
¼ -10 Ma, which supports our intuitive
interpretation of the data. Because the data is
assembled in 10 Ma bins, all we can say is that 1
t
is likely to be in the range 5-15 Ma.
Discussion
The progressive rise of terrestrial vegetation
and the decline of atmospheric CO
2
Katz et al. (2007) mention that the drawdown of
Palaeozoic pCO
2
was very likely caused, in part,
by the sequestration of organic matter as buried
p
CO
2
and Acritarch Genera
30
rCO
2
(from
GEOCARB
III)
rGenus (from Palynodata)
25
20
15
10
5
0
P
Pre
C
C
O
S
D
M
I
P
J
K
N
500
400
300
200
100
0
Geological Time (Ma-Period)
Fig. 4. CO
2
concentration in the atmosphere modelled over Phanerozoic time as represented by the GEOCARB III
model (Berner & Kothavala 2001) plotted with acritarch rGenera (the number of genera in each time bin normalized
to the low value in the Mississippian). The smooth black and grey lines represent the fifth-order polynomial fits to rCO
2
and rGenera, respectively.