Geoscience Reference
In-Depth Information
900
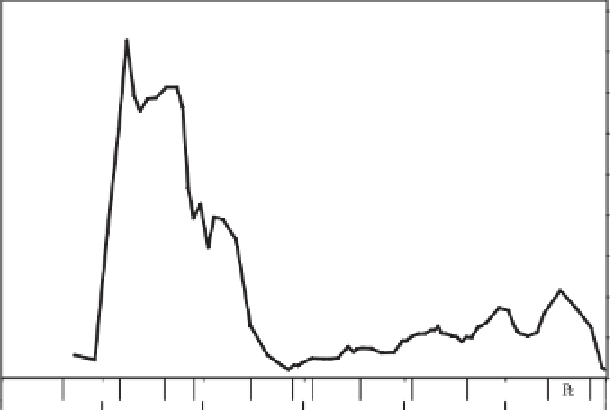
Acritarch Species Richness (by Stage)
800
700
600
500
400
300
200
100
0
Pre
C
C
O
S
D
M
I
P
J
K
N
600
500
400
300
200
100
0
Geological Time (Ma-Period)
Fig. 1. Acritarch species richness plotted per Stage. Acritarch species data acquired from the Palynodata database
(Palynodata Inc. &White 2008) and then filtered (see text). The time bins are re-calibrated fromPalynodata to the values
at www.stratigraphy.org as of December 2008.
soils and buried in sediments and (2) increased
weathering due to the retention of humic acids in a
deeper rhizosphere. In this section we briefly
address these two issues. We first review, briefly,
the fossil record of land plant origins in terms of
the timing and of the kinds of plants that first
covered the land surface. Second, we estimate the
relative impact on the carbon cycle of the evolution
of plants during terrestrialization.
Study of extant plants and green algae has indi-
cated quite clearly that all land plants are derived
from charophycean algae (Graham 1993). Addition-
ally, we know that the bryophyte groups are evol-
utionary intermediates between the algae and the
tracheophytes (Qiu et al. 1998, 2006). The evolution
of terrestrialization therefore began with terrestrial
cyanobacteria and chlorophytic algae (a microbial
mat phase), evolved through a bryophytic phase
14
Acritarch Genus Richness
12
10
8
6
4
2
0
Pre
C
C
O
S
D
M
I
P
J
K
N
600
500
400
300
200
100
0
Geological Time (Ma-Period)
Fig. 2. Acritarch generic richness plotted per Stage as 'rGenera' which is a relative value (linear transform) based on the
number of genera in each bin divided by the smallest value (13) in the Mississippian. Acritarch species data as for
Figure 1.