Geoscience Reference
In-Depth Information
Once transects were scanned, extreme care was used to extract the cores in the correct location to
correspond to the radargram. The cores were screened, and the biomass was separated into live
roots and dead organic debris, dried and weighed.
30.3 ReSUltS And dISCUSSIon
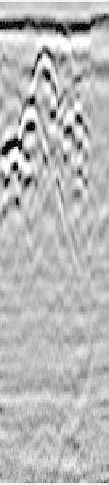
Pine roots are usually found in clusters where it can be difficult to separate individual roots, espe-
cially when their orientation is unknown and may be confused with plane reflectors (Figure 30.2A).
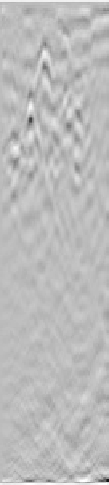
Background removal removes most of the clutter associated with surface reflections, soil horizons,
and moisture gradients (Figure 30.2B). Kirchoff migration serves to collapse the hyperbolas closer
to their representative size and location (Figure 30.2C). The geometry of reflected signals may be
very useful for extracting information about the reflective surface of the root, including diameter if
the root orientation is known (Barton and Montagu, 2004). When a cylindrical root is scanned at
a 90° angle it is possible to calculate diameter, but in the field roots present themselves in a variety
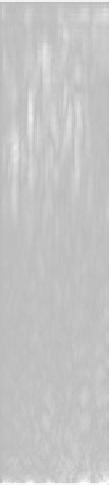
of shapes and orientations. The Hilbert transform is a useful means to illustrate and quantify the
reflection amplitude apart from reflector geometry (Figure 30.2D).
At Sanderson, the correlation between live root mass collected with cores and GPR data was less
than desirable (r = 0.51). The roots were almost exclusively pine, and the dead organic debris was
composed of decaying palmetto roots, residual slash, and dead roots. Debris from the previous pine
plantation had been plowed into the soil and had not decomposed completely after 5 years. From
forty cores, more than half of the biomass was classified as dead organic debris. GPR was not
able separate out live and dead material. A compelling illustration of this problem is shown in
Figure 30.3. Two soil core locations were scanned in a region of high reflectivity, despite having
almost the same amount of biomass and a similar number of pixels in the analysis threshold (GPR
index), core A contained 17 percent live root mass and core B contained 73 percent (Figure 30.3).
0
1
A
B
C
D
E
0
0.5
Transect Length (m)
fIGURe 30.2
Example of a radargram collected at the Sanderson loblolly pine plantation (A) and processed
using background removal (B), Kirchoff migration (C), Hilbert transformation (D) with RADAN software.
Amplitude intensity was visualized and quantified with Sigma Scan Pro software (E).