Geoscience Reference
In-Depth Information
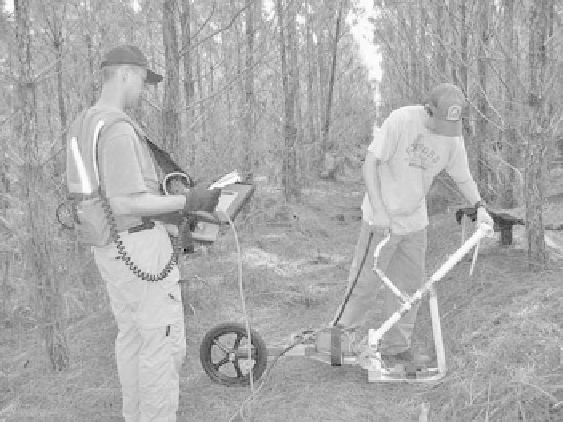
fIGURe 30.1
SIR 2000 ground-penetrating radar (GPR) system connected to a 1500 MHz antenna mounted
on a skateboard deck equipped with a survey wheel encoder.
were made by slowly drawing the survey rig along a measurement transect (200 scans per m) while
ensuring that the antenna remained in contact with the soil surface. The locations of the verification
cores were electronically marked on the data file during collection. The resulting scan was a two-
dimensional profile (transect length by depth) where electromagnetic anomalies are located.
Postcollection processing was accomplished using RADAN 6.5 software (GSSI) with the fol-
lowing steps (Butnor et al.,
2003; Cox et al.,
2005; Stover et al.,
2007):
1.
Crop
. Each radargram was cropped to the diameter of a 15 cm area soil core.
2.
Background Removal
. Root structures appear as hyperbolic reflectors, and parallel bands
represent plane reflectors such as ground surface and soil layers. Parallel bands were
removed with a horizontal finite impulse response filter (FIR) method called background
removal.
3.
Migration
. Kirchoff migration was applied to correct the position of objects and collapse
hyperbolic diffractions based on signal geometry (Daniels, 2004).
4.
Hilbert Transformation
. Hilbert transformation was applied to express the relationship
between magnitude and the phase of the signal, allowing the phase of the signal to be
reconstructed from its amplitude, allowing subtle discontinuities to be detected (Oppen-
heim and Schafer, 1975).
Root mass was quantified by converting radargrams to bitmap images and using Sigma Scan Pro
Image Analysis software (Systat) with the following steps (Butnor et al.,
2003; Cox et al.,
2005;
Stover et al.,
2007):
1.
Gray Scale
. Each image was converted to an 8-bit grayscale image.
2.
Intensity Threshold
. Root mass was quantified by using pixel intensity (proxy for ampli-
tude derived from Hilbert transform). Intensity is a relative measure ranging from 0 (black)
to 255 (white). An intensity threshold range of 60 to 255 pixels, which was able to delineate
roots as small as 0.5 cm was applied.
3.
Statistical Analysis
. Linear regression was performed to quantify the relationship between
total root biomass from the soil cores and the GPR-derived index (pixels within the thresh-
old range).