Geoscience Reference
In-Depth Information
-13
0
13
25
38
50
-13
0
13
25
38
50
We st
East
South
North
0.0
3.0
6.1
Line Distance (m)
9.1
12.2
15.2
0.0
3.0 6.1
Line Distance (m)
9.1
12.2
(a)
(b)
-13
0
13
-13
0
13
25
38
50
We st
East
South
North
25
38
50
0.0
3.0 6.1
Line Distance (m)
9.1
12.2
0.0
3.0
6.1
Line Distance (m)
9.1
12.2
15.2
(c)
(d)
-25
-13
0
13
25
38
We st
East
South
North
0
20
40
60
50
63
80
0.0
2.5
5.0
Line Distance (m)
7.5
10.0
12.5
15.0
17.5
0.0
2.5
5.0
7.5
10.0
12.5
Line Distance (m)
(e)
(f )
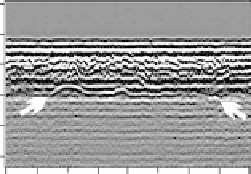
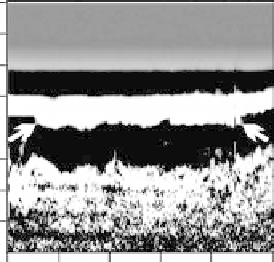
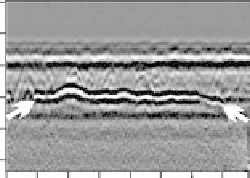
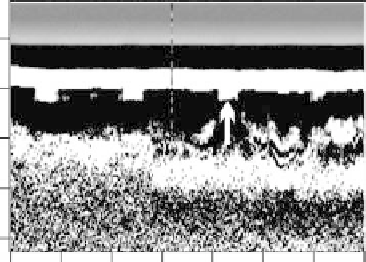
fIGURe 29.3
Ground-penetrating radar (GPR) profiles from ElectroScience Laboratory (ESL) test plot
showing the drainage pipe detection effect of antenna frequency; (a) and (b) 500 MHz center frequency anten-
nas, (c) and (d) 250 MHz center frequency antennas, and (e) and (f) 100 MHz center frequency antennas.
to a greater or lesser extent in Figure 29.3a and Figure 29.3c with refection hyperbola apexes (top of
pipe position) found at travel times between 20 and 25 ns. The Noggin
plus
unit with 500 MHz center
frequency antennas barely detected three of the four pipes, of which one is highlighted with an
upward pointing arrow (Figure 29.3a). The Noggin
plus
unit with 250 MHz center frequency antennas
detected all four pipes (Figure 29.3c), one of which is highlighted with an upward pointing arrow;
although, the response to the one farthest west was fairly subdued. The pulseEKKO 100A unit
with 100 MHz center frequency antennas detected all four pipes (Figure 29.3e); however, the GPR
response to the buried drainage pipes was not the typical reflection hyperbola expected, but rather
a rectangular block-like extension of the top white band down into the black band beneath it (one is
highlighted with an upward pointing arrow). The difference in GPR drainage pipe response of the
pulseEKKO 100A unit with 100 MHz center frequency antennas compared to the other two systems