Geoscience Reference
In-Depth Information
15.0
12.5
10.0
7.5
5.0
2.5
0.0
15.0
12.5
10.0
7.5
5.0
2.5
0.0
0.0
5.0
10.0 15.0
Distance (m)
(a)
20.0
25.0
30.0
0.0
5.0
10.0 15.0
Distance (m)
(b)
20.0
25.0
30.0
15.0
12.5
10.0
7.5
5.0
2.5
0.0
15.0
12.5
10.0
7.5
5.0
2.5
0.0
0.0
5.0
10.0 15.0
Distance (m)
(c)
20.0
25.0
30.0
0.0
5.0
10.0 15.0
Distance (m)
(d)
20.0
25.0
30.0
15.0
12.5
10.0
7.5
5.0
2.5
0.0
15.0
12.5
10.0
7.5
5.0
2.5
0.0
N
0.0
5.0
10.0 15.0
Distance (m)
(e)
20.0
25.0
30.0
0.0
5.0
10.0 15.0
Distance (m)
(f )
20.0
25.0
30.0
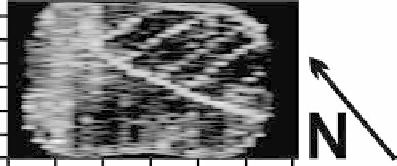
fIGURe 28.4
Ground-penetrating radar (GPR) 9 to 15 ns (0.38 to 0.68 m depth interval) time-slice ampli-
tude map comparison of different field survey setups: (a) interpreted schematic map showing golf course
green areal extent (gray shaded area) and drain line locations (solid black lines for strong evidence and dashed
black lines for weaker evidence); (b) bidirectional survey with a 1 m spacing distance between adjacent mea-
surement lines; (c) bidirectional survey with a 2 m spacing distance between adjacent measurement lines;
(d) bidirectional survey with a 3 m spacing distance between adjacent measurement lines; (e) unidirectional
survey based on one set of parallel northwest-southeast transects with a 1 m spacing distance between adja-
cent measurement lines; and (f) second unidirectional survey based on the other set of parallel southwest-
northeast transects with a 1 m spacing distance between adjacent measurement lines.
adjacent measurement lines. The main conveyance line and the lateral drain lines in the lower half
of the Figure 28.4d time-slice amplitude map are still evident but not as distinct as in Figure 28.4c;
however, the rest of the subsurface drainage system is not interpretable. It is obvious from the
results presented in Figure 28.4b through Figure 28.4d that the spacing distance between adjacent
measurement transects should be no greater than 1 m in order to effectively resolve a golf course
green subsurface drainage system on a GPR time-slice amplitude map.
The Figure 28.4e time-slice amplitude map is based on a unidirectional survey (one set of paral-
lel northwest-southeast transects) with a 1 m spacing distance between adjacent measurement lines.
Because the orientation of the measurement transects for Figure 28.4e is essentially perpendicular
to the orientation of the drainage pipe laterals shown in the bottom half of the map, these drainage
pipe laterals show up extremely well. There are plenty of indications regarding the main conveyance