Geoscience Reference
In-Depth Information
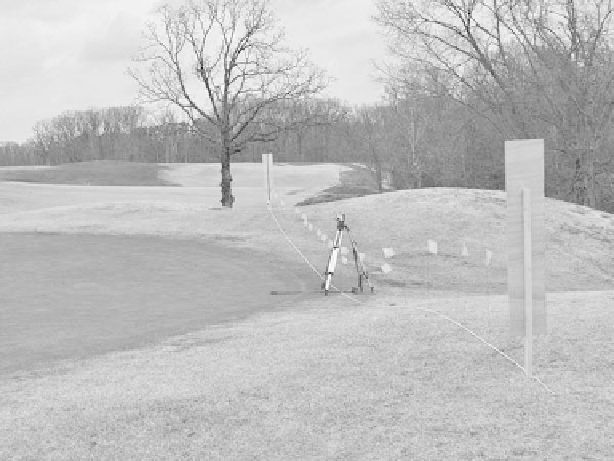
fIGURe 27.3
Grid layout.
fertilizer may possibly cause some distortion as well. The 400 MHz antenna was used in the same
area, but very little noise was found. In order to prevent the interference by the applied chemicals,
the 400 MHz antenna was used for the entire study. Data were collected at each flagged line and
marked at every meter point. The speed of pulling the antenna would be best if the scanning speed
can be maintained constant.
At the Stone Creek Golf Course (SCGC) site, the team took about 45 minutes to complete the
entire measurement, including flagging and scanning. For the green at Hickory Ridge Golf Course
(HRGC), the experiment was finished within 30 minutes. On both greens, it took longer to overlay
and flag the sampling pattern than to scan the site.
27.2.5 d
a t a
P
R o c e s s i in g
In the analysis, the software RADAN (Geophysical Survey Systems, Inc.. Salem, NH) was used for
analyzing the image data. The first step in processing was to correct the horizontal scale by normal-
izing the data. After removing all pauses or speed changes between markers, the data were filtered
to remove any unnecessary noise or clutter and keep the needed reflection signal. The last major
step was to migrate the data to display the hyperbola image of the drain tile. The processed two-
dimensional image provided the location of the drain tile. The data could be expressed as a two- or
three-dimensional image.
27.3 ReSUltS And dISCUSSIon
In Figure 27.4, the vertical scale has been exaggerated and the horizontal scale has been compressed.
The horizontal scale represents units of distance traveled along the traverse; the vertical scale rep-
resents depth. In Figure 27.4, the upper-most interface (upper marked line) represents reflections
from the turf surface. The turf surface appears as a series of continuous, parallel bands. At 1 m, this
interface appears higher and discontinued on the radar profile. However, on the actual surface of the
green, everything appears to be level across the entire green. The apparent rise in the soil surface
at 1 m is attributed to a localized acceleration in the velocity of radar signal propagation through
this portion of the sandy rooting mixture. Golfers typically exit the green in this area, which caused