Geoscience Reference
In-Depth Information
20
18
16
14
12
10
8
6
4
2
0
0246810
12
14
16
18
20
Easting (m)
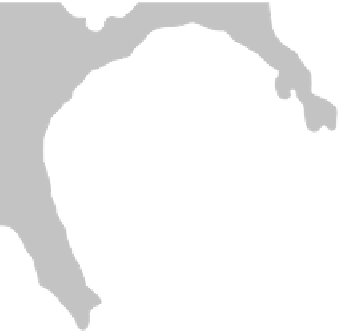
fIGURe 21.5
Perpendicular (PRP) electrical conductivity contours at the Golf Course of Dublin (GCD).
strong and local fluctuations in apparent
conductivity are caused by buried metal of
watering systems and other utilities (e.g., at
18 E, 3 N).
The area of low conductivity shows the
extent of the sand under the green. Within
the area, a north-south trend of slightly lower
conductivity lies roughly at 11 E. This may
indicate a drainage trench that might have
been cut into the native soil at the base of the
sand and filled with resistive material. The
PRP contours suggest drainage structures
that extend northwest and northeast from the
central portion of the feature at 11 E. Drain-
age of the area is from north to south, and
the lower conductivities in the northern por-
tion of the green suggest that this portion of
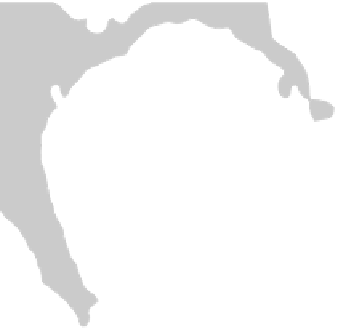
the sand is the driest. The HCP contours of
Figure 21.6 also indicate the extent of the
sand but with significantly less contrast in
conductivity, as predicted by the previous
modeling of responses. The HCP measurements also are lowest in the northern portion of the green,
indicating that core of the conductivity decrease is near the base of the sand, a depth at which the
HCP array has comparable sensitivity to the PRP array.
Figure 21.7 and Figure 21.8 contain contours of the H/P-1 apparent conductivities from the tra-
verses at the MVGC green. The PRP measurements of Figure 21.7 sharply define an area of low
conductivity that shows the limit of the sand beneath the green, except on the northern portion of the
eastern border where the traverse lines ended on the green. Note that the contours at the edge of the
sand are generally closer together than those at the GCD California-method green, in keeping with
the vertical interface between sand and soil specified for USGA-method greens. A curved trend of
slightly lower conductivity extends from (6 E, 5 N) to (15 E, 21 N) and coincides with the location
of the main drain beneath the green. Trends that branch to the west and south from (10 E, 17 N) may
20
18
16
14
12
10
8
6
4
2
0
0246810
12
14
16
18
20
Easting (m)
fIGURe 21.6
Horizontal coplanar (HCP) electrical con-
ductivity contours at the Golf Course of Dublin (GCD).