Geoscience Reference
In-Depth Information
1
HCP
PRP
0.5
0
0
0.1
0.2
0.3
0.4
0.50.6
0.70.8
0.91
Depth (m)
fIGURe 21.2
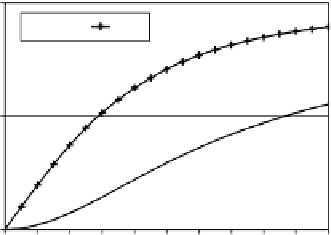
The 1 m horizontal coplanar/perpendicular (HCP/PRP) depth sensitivities.
and the cumulative depth sensitivity of the PRP array is
C
P
= 2 ρ/(4 ρ
2
+ 1)
1/2
(21.3)
Figure 21.2 graphs these functions for arrays with ρ of 1 m.
Note that there is an appreciable difference in the functions. For example, about half the sen-
sitivity of the PRP array accumulates within a depth of about 0.3 m, and half the sensitivity of the
HCP array accumulates within a depth of about 0.9 m. As these depths are similar to the depths of
golf-course features, an H/P-1 at ground level appears to be suitable for mapping such features. The
difference in cumulative sensitivity is the basis for resolving changes in conductivity with depth, as
the 1 m PRP array is relatively sensitive to material to a depth of about 0.5 m, and the 1 m HCP array
is relatively sensitive to material between the depths of about 0.3 and 1.5 m.
21.4 Golf-CoURSe GReen Model
A model based on the sensitivity functions can predict the apparent conductivities that will be mea-
sured over a feature of interest (e.g., a golf-course green). The modeling exercise can help assess
the potential effectiveness of EMI for a given
application. Figure 21.3 shows the apparent con-
ductivities that the H/P-1 would measure over a
model golf-green that is composed of materials
of given conductivity. The model contains a layer
of 10 mS/m material, representing sand, over 50
mS/m material, which represents the native soil.
The thickness of the sand layer is zero at stations
0 and 20, 0.3 m at stations 3 through 8 and 12
through 17, and 0.5 m at station 10.
Although the native soil extends to the sur-
face at stations 0 and 20, the HCP apparent con-
ductivity will be a fraction of a mS/m and the
PRP apparent conductivity will be a few mS/m
less than the native-soil value of 50. This results
from the fact that when the H/P-1 rests on the
ground, its arrays are about 5 cm above the
ground due to their positioning in the instrument.
50
40
30
20
HCP
PRP
10
0
5
10
15
20
Station
fIGURe 21.3
Model responses for a golf-course
green.