Geoscience Reference
In-Depth Information
measured EC
a
with depth. Although clay content controls EC
a
(0 to 30 cm), soil water and salts (NO
3
and NH
4
) may drive EC
a
(0 to 90 cm) and yield. Hence, the positive correlation.
18.3.4 P
h a s e
iv: ec
a
v e R s u s
M
i c R of b i a l
-s
c a l e
M
e a s u R e M e n t s
(J
o h n s o n
e t
a l
., 2004)
Soil edaphic and biological (community composition, diversity, and activity) variability occurs
across multiple levels of scale. It is useful to evaluate this variability, as it relates to sustainable man-
agement within the context of a farm. This can be conceptualized as originating with the microbe
(micron scale) and continuing upward to sampling site, within-field, field, and farm levels (multiple-
ha scale) (Figure 18.1).
Microbial-scale
analyses of VAM fungi were evaluated for significant cor-
relations with EC
a
, and with
sampling-site scale
soil properties and
field-scale
yield data integrated
by EC
a
(Phases II and III). Concentrations of glomalin were negatively correlated with EC
a
and
positively correlated with soil quality and winter wheat yields, across crop treatments. The C16 bio-
marker and wet aggregate stability were different among crop treatments as fallow < wheat < corn <
millet and were negatively correlated with EC
a
in the fallow treatments (effect of crop removed).
Due to significant partitioning of these
microbial-scale
measures among EC
a
productivity zones,
they can be linked to both soil chemical and physical characteristics and crop yields. Thus, EC
a
zones offer a pivotal point of reference through which
microbial-
,
sampling-site-
, and
field-scale
data can be related.
18.3.5 P
h a s e
v: ec
a
f o R
e
x P e R i M e n t a l
d
e s i g in
a n d
a
n a l y s i s
(J
o h n s o n
e t
a l
., 2003
a
, 2005)
In classic experimentation, small plots are arranged in a randomized complete block design where
blocks serve to increase precision by reducing experimental error due to soil heterogeneity. Blocks
are placed in areas of similar production potential that have been identified by analyzing soil
samples for yield-significant properties. Topography, soil fertility, and soil series exemplify tra-
ditional blocking factors, and EC
a
productivity zones were examined for this purpose at the FICS.
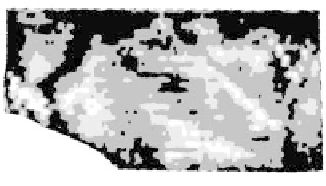
Figure 18.6 illustrates the relationship between EC
a
productivity zones and plot-scale blocking. The
32 ha field shown on the left is separated into four classes of EC
a
(a), three of which form blocks
in the traditional plot-scale experiment set in a randomized complete block design (b). Because
blocks are homogeneous, plots need not be adjacent but could be placed anywhere in field (a) within
assigned blocks. Thus, the entire 32 ha field can be conceptualized as an enlarged version of the
plot-scale experiment, where variance across EC
a
-delineated productivity zones is equivalent to
experimental error in the plot-scale experiment.
To test this, soil and residue data from the FICS were compared with those taken from a nearby
plot-scale experiment (Peterson et al., 1993). For each soil and residue measurement, within-field
N
40 m
C
F
WM
W
M
C
F
M
W
F
C
(a)
(b)
fIGURe 18.6
Relationship between apparent soil electrical conductivity (EC
a
) productivity zones and plot-
scale blocking. (a) An EC
a
-zone map of a ≈31 ha field at the Farm-Scale Intensive Cropping Study and (b) a
typical plot-scale experiment identified within the field using EC
a
productivity zones as a basis for blocking.


