Geoscience Reference
In-Depth Information
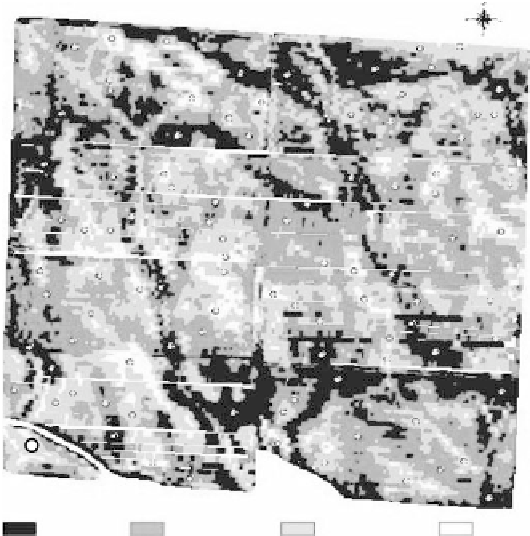
Low EC
Med. Low EC
Med. High EC
High EC
fIGURe 18.4
Farm-Scale Intensive Cropping Study EC
a
zone map and soil sampling scheme.
tAble 18.1
Case Study vI: partial listing of Soil properties (0 to 30 cm) Including within-electrical
Conductivity (eC
a
) zone Means and Significance across Crop treatments,
and Correlation (
r
) with Measured eC
a
erosion-Associated
factors
productivity-Associated factors
eC
a
Ranges
dS m
-1
Water
Content
kg kg
-1
bulk
density
g cm
-3
SoM ¶
Mg ha
-1
total C
Mg ha
-1
total n
Mg ha
-1
p ¶
kg ha
-1
pMn ¶
kg ha
-1
Clay
%
ph
EC
a
zone
*
**
**
**
**
*
†
*
**
Low
0.00-0.17
0.207
124.8
43.8
4.08
111.8
86.4
1.32
22.8
6.33
Medium
0.12-0.23
0.187
115.9
35.2
3.45
69.2
67.0
1.39
24.3
6.42
low
Medium
0.14-0.29
0.185
110.4
32.2
3.09
27.8
59.3
1.39
27.3
6.72
high
High
0.18-0.78
0.178
112.6
32.7
3.10
26.7
54.4
1.42
28.1
6.92
r
values
(
p
< 0.001)
-0.33
-0.34
-0.36
-0.38
-0.58
-0.50
0.49
0.50
0.37
¶ SOM = total soil organic matter; P = extractable P; PMN = potentially-mineralizable NH4-N.
†, *, ** Comparisons of ECa class treatments are significant at the 0.10, 0.05, and 0.01 levels, respectively.