Geoscience Reference
In-Depth Information
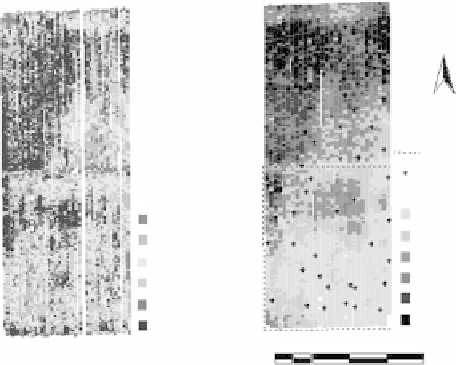
(a) Cotton Yield
(b) EC
a
Survey & Soil
Core Sites
N
Canal
Core sites
EC
a
(dS/m)
0-1.5
1.5-2
2-2.5
2.5-3
3-3.5
3.5-5
Yield (Mg/ha)
1-3
3-4.5
4.5-5.5
5.5-6.25
6.25-6.75
6.75-11.25
100
0
100
200
300Meters
fIGURe 16.1
Maps of (a) cotton yield and (b) EC
a
measurements including sixty soil core sites. (Modified from
Corwin, D.L., Lesch, S.M., Shouse, P.J., Soppe, R., Ayars, J.E.,
Agron. J.
, 95, 352-364, 2003. With permission.)
the sample sites from the EC
a
survey data. The software uses a model-based response-surface sam-
pling strategy. The selected sites reflect the observed spatial variability in EC
a
while simultaneously
maximizing the spatial uniformity of the sampling design across the study area. Figure 16.1b shows
the spatial EC
a
survey data and the locations of the sixty core sites. Soil samples were collected at
0.3 m increments to a depth of 1.8 m. Soil samples were analyzed for physical and chemical proper-
ties thought to influence cotton yield including gravimetric water content (θ
g
), bulk density (ρ
b
), pH,
B, NO
3
-N, Cl
−
, electrical conductivity of the saturation extract (EC
e
), leaching fraction (LF), per-
centage clay, and saturation percentage (SP). All samples were analyzed for physical and chemical
properties following the methods outlined in Agronomy Monograph No. 9 (Page et al., 1982).
16.2.4 s
t a t i s t i c a l
a n d
s
P a t i a l
a
n a l y s e s
Statistical analysis was conducted using SAS software (SAS, 1999). The statistical analysis con-
sisted of three stages: (1) determination of the correlation between EC
a
and cotton yield using data
from the sixty sites, (2) exploratory statistical analysis to identify the significant soil properties
influencing cotton yield, and (3) development of a crop yield response model based on ordinary least
squares regression (OLS) adjusted for spatial autocorrelation with restricted maximum likelihood.
Because the location of EC
a
and cotton yield measurements did not exactly overlap, ordinary krig-
ing was used to determine the expected cotton yield at the sixty sites.
Spatial analysis was accomplished with a geographic information system (GIS). The commer-
cial GIS software ArcView 3.3 (ESRI 2002) was used to compile, manipulate, organize, and display
all spatial data. Delineation of SSMUs was accomplished using the GIS, exploratory statistical
analyses, and crop yield response model adjusted for spatial autocorrelation.
16.3
ReSUltS And dISCUSSIon
16.3.1 c
of R R e l a t i of n
b e t w e e n
c
R o P
y
i e l d
a n d
ec
a
The correlation of EC
a
to yield at the sixty sites was 0.51. The moderate correlation between yield
and EC
a
suggests that some soil properties influencing EC
a
measurements may also influence cotton
yield, making an EC
a
-directed soil sampling strategy a potentially viable approach at this site. The