Geoscience Reference
In-Depth Information
107
138B
55
507
138B
+
Sampling grid
Transects
Soils
55 Nicollet
90 Okoboji
95 Harps
138 Clarion
507 Canisteo
138B
138B
55
55
138C
55
90
507
95
138B
507
507
507
138B
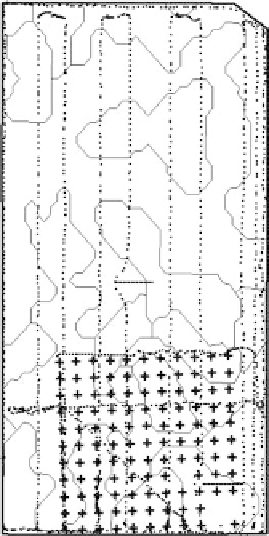
fIGURe 14.1
Grid locations for soil sampling and apparent electrical conductivity, EC
a
, measurements, and
transects where additional EC
a
measurements were made superimposed on the soils map for a 32 ha field.
Atrazine sorption was determined on duplicate 4 g samples of air-dried soil that had passed a
2 mm sieve. Soil was equilibrated with 15 ml of solution containing 1.5 mg L
−1
atrazine dissolved in
0.01
M
CaCl
2
for 72 h. The solution was then centrifuged, and atrazine in the supernatant analyzed
with high-performance liquid chromatography (HPLC) as outlined by Novak et al. (1994).
At the same time soil samples were collected, apparent electrical conductivity measurements
(EC
a
) were made with an EM38 electromagnetic induction meter (Geonics Limited, Ontario, Can-
ada). A single reading was made at each grid point with the meter in the vertical dipole orientation
and suspended 20 cm above the soil surface. Readings were taken with the meter suspended above
the soil surface rather than on the surface so that the results were directly applicable to a companion
transect survey. A vertical rather than horizontal orientation was used so that slight variations in
the spacing between the meter and soil surface would have minimal effect on the readings (Rao and
Davidson, 1980) during the transect survey. A horizontal orientation may have resulted in values
better correlated to the surface soil properties measured for this study. Two days after making EC
a
measurements at the grid locations, a transect survey of the entire 32 ha field was made. The EM38
was attached to a wooden boom suspended 20 cm above the ground and pulled by a five-wheel,
all-terrain vehicle equipped with a GPS (Ambuel et al., 1991). Electrical conductivity was recorded
along with position at 2 s intervals while driving transects across the field (Figure 14.1).
Contour maps of the values collected within the intensive grid area were produced using Surfer
software (Golden Software, Inc., Golden, CO) based on a 41 × 41 grid produced by a linear kriging
interpolation procedure embedded within the software. A contour map of EC
a
from the transect
survey of the entire 32 ha field was produced in a similar manner for a 50 × 100 grid using the rela-
tionship found between EC
a
and K
d
.
Descriptive statistics and regressions were computed using standard methods (Draper and Smith,
1966; Snedecor and Cochran, 1967). Correlograms were calculated using the method described in
Davis (1973). The spatial structure of the mapped properties was quantified using Moran's I statistic
(Moran, 1950; Upton and Fingleton, 1985). Moran's I is similar in concept to correlation and ranges