Geoscience Reference
In-Depth Information
The National Geodetic Survey developed a SPC system for each state. To convert a geodetic
position to plane rectangular coordinates, the point needs to be projected. A mathematical process
is used to project points from the earth ellipsoid to an imaginary developable surface, which is a
surface that can be unrolled and laid out flat without any distortion of shape or size. Two com-
monly used map projections are the Lambert conformal conic, where the projection is made onto
the surface of an imaginary cone, and the transverse Mercator projection, which uses a cylinder
as the developable surface. The Lambert projection is typically used for mapping states that are
narrow in the north-south direction, but are longer in the east-west direction. Examples include
states like Kentucky, Montana, Pennsylvania, and Tennessee. The transverse Mercator projection
is used for mapping states that are narrow in the east-west direction, but are longer in the north-
south direction. Examples include states like Illinois, Indiana, and New Jersey. Figure 10.3 shows
an agricultural test site in Ohio—the Management System Evaluation Area (MSEA) site located
in Piketon—in three different standard map coordinate systems. Another common map projection
system is the UTM system that is used worldwide. The UTM system was developed by the military
and covers the earth from 84°N latitude to 80°S latitude. There are sixty zones, with each zone
6° wide in longitude. The
x
,
y
coordinates are in meters, in northing and easting values.
Selecting an appropriate coordinate system for a GIS requires several considerations, which
include the data types, existing coordinate system in the data layers, and future data layers to be
generated. The data types will often result in positioning accuracy issues during a coordinate sys-
tem conversion. For example, converting a raster data layer from one coordinate system to another
may require rotating, shifting coordinates, and a resampling process that may severely distort the
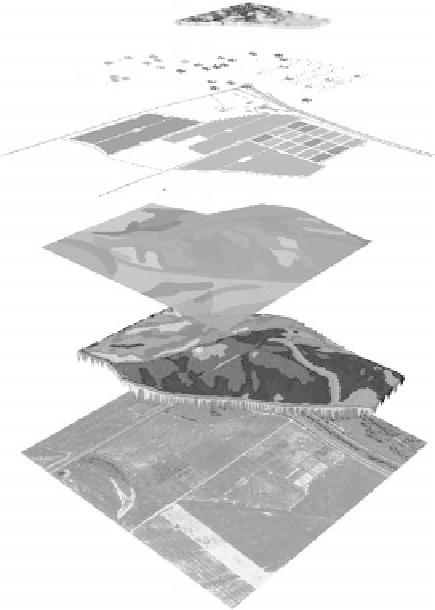
Yield Maps
Sampling site layers:
- 1994 & 1998 plant sampling grid
- Wells
- Soil sampling sites
Ground features & site plan
Soils map
DEM
- TIN from DGPS point source
- Grid from topographic map
Basemap
- Coordinate reference
- Ground features
fIGURe 10.3
Data layers created for use in a geographic information system (GIS) for the Management
System Evaluation Area (MSEA) site in Ohio. (Courtesy of S.-S. Lin, pers. comm., 2006.)