Geoscience Reference
In-Depth Information
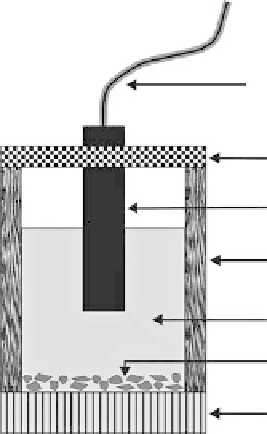
Insulated
electric cable
Plastic
container lid
Copper
electrode
Plastic
container side
Copper sulfate
solution
Copper sulfate
crystals
Porous
ceramic base
fIGURe 8.5
Typical components making up a nonpolarizing electrode.
stake electrodes are canceled out by injecting low-frequency alternating current into the subsurface,
which is an option not relevant for the self-potential method. Therefore, nonpolarizing electrodes
are required for self-potential data collection. A nonpolarizing electrode, as shown in Figure 8.5, is
typically made of a copper rod inserted through the lid of a container that is porous at its base and
filled with a saturated, aqueous, copper sulfate solution (Milsom, 2003). The voltmeter employed
to measure the electric potential difference between the two nonpolarizing electrodes needs to have
a high input impedence of at least 1 × 10
8
ohms and a measurement resolution of 1 mV (Reynolds,
1997; Sharma, 1997). The electric cable that
connects the voltmeter between the two nonpo-
larizing electrodes should be insulated (polyeth-
ylene or Teflon coating) copper, copper/steel, or
cadmium/bronze wire with an American Wire
Gauge (AWG) thickness between 18 and 26.
The thicker insulated wire with the lower gauge
of 18 should be employed for rough field con-
ditions that require an electric cable with more
durability.
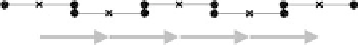
There are two procedures for collecting
self-potential data in the field. The first mode of
data collection is illustrated in Figure 8.6a and
involves consecutively moving both electrodes
(
P
1
and
P
2
) together along a transect, with the
separation distance between the electrodes kept
constant. For each move of the electrode pair, the
new position of the trailing electrode (
P
1
) corre-
sponds with the previous position of the leading
electrode (
P
2
). The reference location for each self-potential voltage measurement is assumed to be
the midpoint between the two electrodes (x-position in Figure 8.6a). Each measurement obtained
with this first data collection mode is reported either as an electric potential difference (voltage) or
as an electric potential gradient (voltage divided by the separation distance between electrodes).
The second mode of self-potential data collection is shown in Figure 8.6b. With this second data
P
1
P
2
P
1
P
2
P
1
P
2
P
1
P
2
P
1
P
2
1
2
3
4
(a)
P
1
P
2
P
2
P
2
P
2
P
2
1
2
3
4
(b)
fIGURe 8.6
The two modes of self-potential data
collection: (a) both electrodes are moved along a
transect, with the separation distance between elec-
trodes kept constant; and (b) one electrode remains
stationary at a base station, while the second electrode
is moved along a transect or a series of transects. (
P
1
and
P
2
are potential electrodes.)