Geoscience Reference
In-Depth Information
Distance, m
Distance, m
0
10
0
0
10
0
100
100
200
200
300
300
400
400
500
500
(a) Wiggle trace
(b) Wiggle trace, positive fill
fIGURe 7.10
Wiggle-trace displays without and with positive amplitude fill.
Distance, m
Distance, m
0
0
10
0
0
10
100
100
200
200
300
300
400
400
500
500
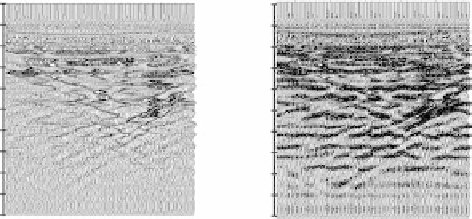
(a) Wiggle trace
(b) Gray-scale scan
fIGURe 7.11
Scan displays: (a) the conversion of a wiggle-trace display to a color scan display and (b) a
gray scale scan display.
7.5.1.2
three-dimensional displays
Three-dimensional displays are fundamentally block views of GPR traces recorded at different
positions on the surface. Data are usually recorded along profile lines, in the case of a continuous
recording system, or at discrete points on the surface in fixed-mode recording (Figure 7.12). In
either case, the antennas must be oriented in the same polarization orientation direction for each
recording position if linearly polarized dipole antennas are used.
Obtaining a good three-dimensional display is a critical part of interpreting GPR data. Targets
of interest are generally easier to identify and isolate on three-dimensional data sets than on con-
ventional two-dimensional profile lines. Simplifying the image by eliminating the noise and clutter
is the most important factor for optimizing the interpretation. Image simplification may be achieved
by carefully assigning the amplitude-color ranges, displaying only one polarity of the GPR signal,
using a limited number of colors, decreasing the size of the data set displayed as the complexity
of the target increases, displaying a limited time range (finite-thickness time slice), and carefully
selecting the viewing angle. Further image simplification in cases of very complex (or multiple)
targets may also be achieved by displaying only the peak values (maximum and minimum values)
for each trace. Finite-thickness time slices and cross sections have many advantages over the infini-
tesimal thin slices routinely used for interpreting GPR data. These principles are illustrated in a
stepwise fashion in Figure 7.13.