Geoscience Reference
In-Depth Information
C
1
P
1
P
2
C
2
C
1
P
1
P
2
C
2
C
1
P
1
P
2
C
2
x
x
x
1
2
(a)
C
1
C
1
C
1
P
1
P
2
C
2
C
2
C
2
2
1
1
2
x
(b)
C
1
1
C
1
2
P
1
P
1
×
C
2
P
2
P
2
P
1
C
1
P
2
C
2
C
2
(c)
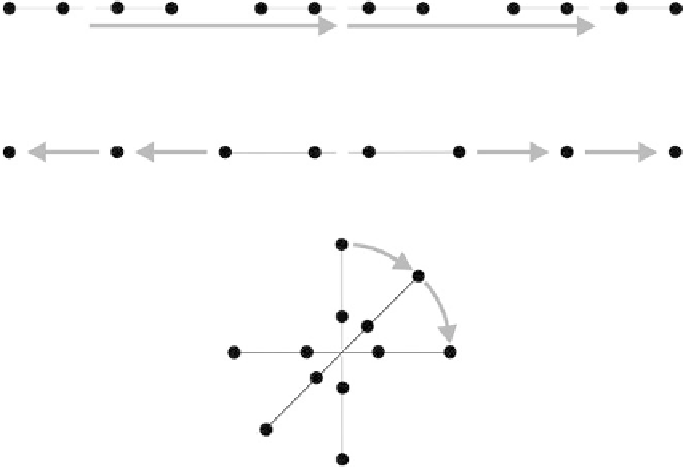
fIGURe 5.10
Field data collection modes: (a) constant separation traversing, (b) vertical electric sounding,
and (c) azimuthal rotation (
C
= current electrode,
P
= potential electrode, × = electrode array midpoint).
more than one pair of potential electrodes (or more than one potential dipole), a single survey pass is
sometimes all that is needed, because in effect, apparent resistivity values are being obtained simul-
taneously for two or more electrode arrays of different length and investigation depth.
Although not used to the extent of constant separation traversing and vertical electric sounding,
there is a third mode of resistivity data collection, perhaps best referred to as “azimuthal rotation.”
Azimuthal rotation data collection, as shown in Figure 5.10c, is carried out with either the electrode
array midpoint or one of the array's end points kept stationary, while successive ρ
a
measurements
are made as the usually linear electrode array is pivoted about this stationary point in increments
of 10° to 20° through a complete sweep of 180° or 360° (Watson and Barker, 1999). Wenner and
Schlumberger electrode configurations are most commonly used (Steinich and Marín, 1997; Taylor
and Fleming, 1988; Watson and Barker, 1999), but square electrode array patterns have also occa-
sionally been employed (Lane et al., 1995). The spacing between electrodes remains constant as the
array is pivoted about a point. A sweep of 180° is all that is required, but 360° sweeps are useful
because two measurements are obtained for each array orientation. (A line rotated 180° has the
same trend as it did before rotation.) Once the complete 180° or 360° sweep of ρ
a
measurements is
completed, the entire electrode array is moved to a new stationary pivot point where another set of
azimuthal measurements are collected. Azimuthal rotation data collection is employed to quantify
the directional components of resistivity (resistivity anisotropy), which may itself provide useful
information on the presence and trends of aligned features in the subsurface. These azimuthal mea-
surements are usually obtained with conventional four-electrode array equipment.
5.10 dAtA AnAlySIS pRodUCtS
Figure 5.11 through Figure 5.13 illustrate some of the fundamental data analysis products produced
from constant separation traversing, vertical electric sounding, and azimuthal rotation resistiv-
ity surveys. The apparent resistivity, ρ
a
, measurements obtained along a transect during constant