Geoscience Reference
In-Depth Information
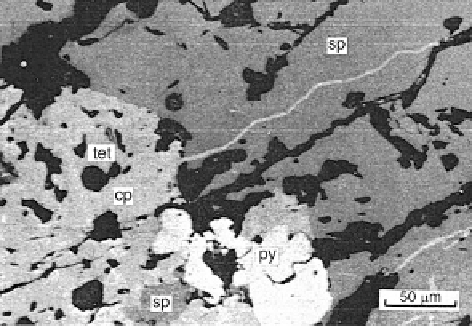
Fig. 2.8 Micrograph
of massive sulphide ore
in Pulacayo Mine
(After Villaipando and
Ueno
1987
). Ore minerals
are
sp
sphalerite,
tet
tetrahedrite,
cp
chalcopyrite,
py
pyrite
(Source: Agterberg
2012
,
Fig. 3)
microscopic scale. The silver was in the form of fine grains associated with
tetrahedrite. In a conference report by Villaipando and Ueno (
1987
) it can be
seen that zinc content of sphalerite varied between 65.62 % and 66.03 %.
This implies that maximum possible zinc content would be 66 % and this is
above the largest value of 39.3 % zinc in Table
2.4
. However, because the sampled
material consisted not only of massive sulphide but also out of mineralized wall
rock, the largest possible value is probably considerably less than 66 %. This upper
limit must have constrained maximum possible zinc enrichment.
On the 446-m level, average thickness of massive vein filling averaged only
0.50 m in width but wall rocks on both sides contained disseminated sphalerite,
partly occurring in subparallel stringers. The channel samples were cut over a
standard width of 1.30 m corresponding to expected mining width. Consequently,
each assay value represents average weight percentage zinc for a rod-shaped
channel sample of 1.30 m cut perpendicular to the vein (Fig.
2.9
). Figure
2.10
is
a smoothed version of the 118 values of Table
2.5
. The signal-plus-noise method
used for this smoothing was described in detail in Agterberg (
1974
). It assumes that
each zinc value is the sum of a “signal” component for continuous change along
the series plus a random white-noise component. Together these two components
were assumed to produce an autocorrelation function of the type
ah
)
were
h
represents distance along the drift as will be discussed in more detail in
Chap.
6
. Filtering out the noise component produces the signal shown in Fig.
2.10
.
Various other statistical methods such as simple moving averaging, kriging
or inverse distance weighting could be used to produce similar smoothed
patterns. The method used to estimate the signal values of Fig.
2.10
will be
The fact that the average zinc content (
ˁ
h
¼
c
· exp(
15.61 %) on the 446-m level differs
from the 14 % overall average for the Tajo vein supports Ahlfield's observation that
average zinc content increases downwards. Obviously, there existed large-scale
zinc-composition “trends” in this ore deposit. In order to capture some of these
trends, Agterberg (
1961
) fitted a sine function to the first 65 values in Table
2.4
but
his best-fitting amplitude of 2.77 % is not statistically significant.
¼
Search WWH ::

Custom Search