Geoscience Reference
In-Depth Information
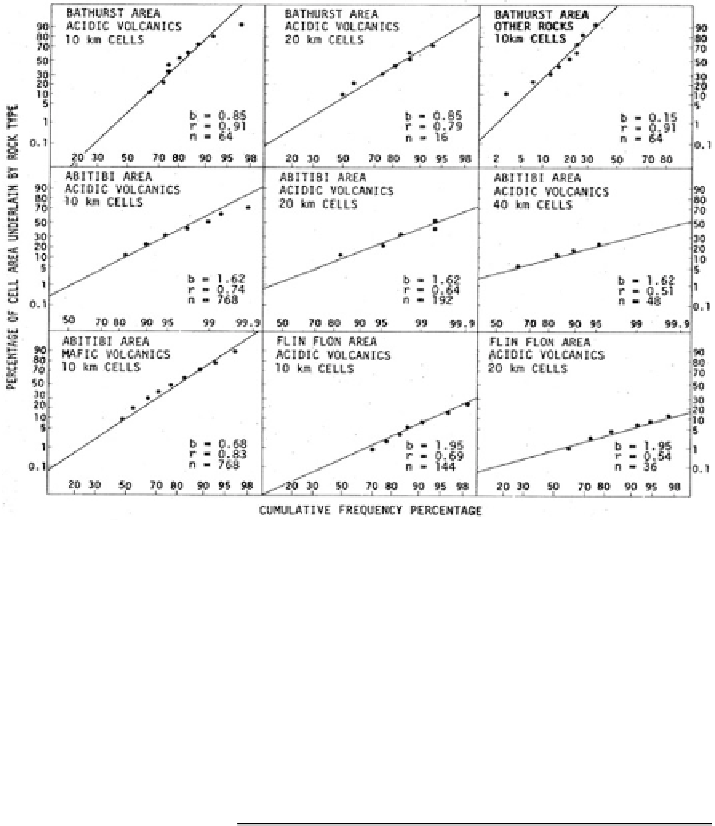
Fig. 12.53 Experimental frequency distributions for nine samples of cell values plotted along
axes with two normal probability scales (from Agterberg
1981
). The values of
b
and
r
were
obtained from the means and variances of the cell values using Fig. 12.53. They determine the
positions and slopes of the lines for probnormal distributions (Source: Agterberg
1984
, Fig. 9)
Table 12.3 Estimation of the
values
ˈ
1
i
(Source: Agterberg
1984
, Table 2)
i
0
1
2
3
N
C
i
q
N i
1
p
i
1
15
q
1
1
p
1
105
q
1
1
p
1
455
q
1
1
p
1
q
1
1
f
i
(
z
1
)
0.66667
0.27400
0.05255
0.00624
F
i
(
z
1
)
0.66667
0.94066
0.99322
0.99946
x
1
(
F
i
)
0
0.0282
0.0540
0.0765
ˈ
1
i
0
0.0141
0.0411
0.06525
that, in general, the relationship between variance and cell size can be determined
independently by geostatistical methods of 2-D integration such as the one
explained in Sect.
12.8.3
for acidic volcanics in the Bathurst area. There are
512 empty cells in Fig.
12.49
. Therefore, the frequency of zero values satisfies
q
1
N
¼
512/786
¼
0.66667. Several values of
N
5 were tried yielding nearly the
same results. Setting
N
¼
15 gives
q
1
¼
0.97333 and
p
1
¼
1
q
1
¼
0.02667. A
q
N
1
1
N
i
sequence of values
f
i
zðÞ
¼
p
1
ˈ
1
i
is
the corresponding values of
shown in Table
12.3
.
The cumulative frequency
F
i
(
z
1
) in Table
12.3
is close to 1.0 for
i
¼3. The
cumulative frequency distribution for 10-km cells was plotted and the
corresponding values of
x
1
(
F
2
) were read from the resulting graph. The
ˈ
1
i
values

Search WWH ::

Custom Search