Geoscience Reference
In-Depth Information
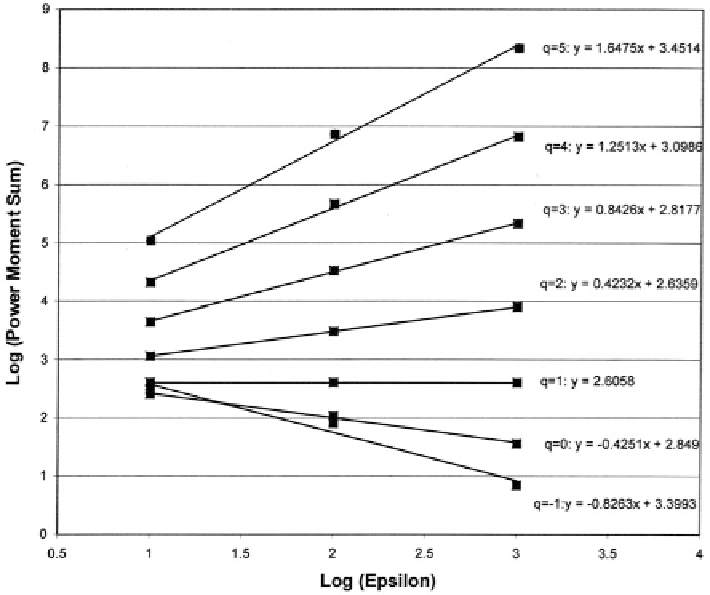
Fig. 12.50 First step of multifractal analysis (power-moment sums) of acidic volcanics in
768 square cells (Abitibi area, Canadian Shield) measuring 10 km on a side of example of
Figs.
12.47
and
12.48
. Logarithms base 10 (Source: Agterberg
2005
, Fig. 3)
The resulting estimates of
were 1.62 and 0.74, respectively; versus 1.51 and
0.65 as derived from the lest-fitting line. The difference between the two straight
lines is probably due to differences in weighting of the observed frequencies.
In the two case history studies on 2-D occurrences of acidic volcanics in the
Bathurst and Abitibi areas it was shown that the probnormal model is applicable in
modeling the frequency distribution of amounts of acidic volcanics contained in
cells of variable size. In Fig.
12.53
these probnormals are shown together with
results of a number of other applications. In each case, slope and intercept of the
straight line were computed from mean and variance using Fig.
12.39
. It has been
pointed out that the probnormal generally also can be obtained simply by fitting a
straight line to the points in a prob-prob plot. In the last section another example of
cell compositional data will be discussed (asymmetric bivariate binomial distribu-
tion). It also leads to good results for acidic volcanics in the Abitibi area. This
model has potential for modeling the frequencies of empty small empty cells of
variable cells because it has one more parameter than the probnormal.
ʲ
and
ˁ
Search WWH ::

Custom Search