Geoscience Reference
In-Depth Information
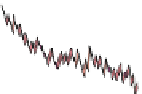
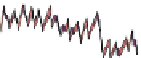
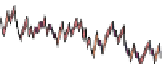
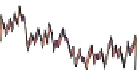
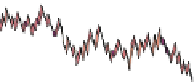
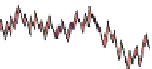
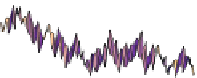
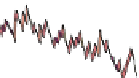
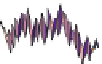
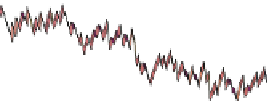
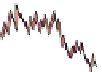
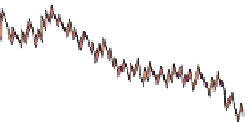
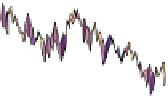
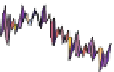
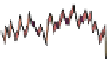
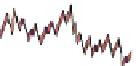
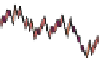
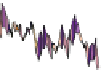
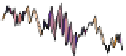
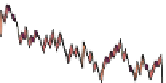
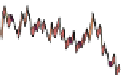
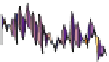
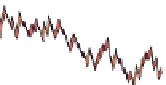
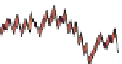
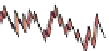
Fig. 12.25 Realization of
accelerated dispersion
model for
d
0
¼
0.4,
N
¼
14,
and
p
¼
0.01. Vertical scale
is for 4 + log
10
(Value)
(Source: Agterberg
2007b
,
Fig. 5)
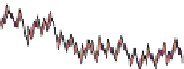
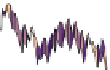
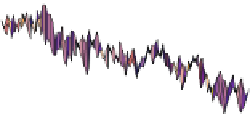
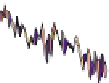
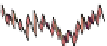
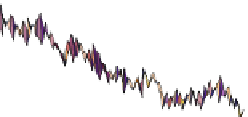
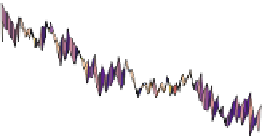
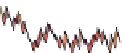
6
4
100
2
50
50
100
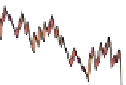
3
2.5
2
1.5
1
0.5
0
0
0.5
1
1.5
2
2.5
Log (Value); Log binomial Model
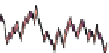
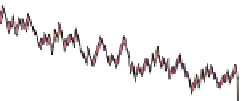
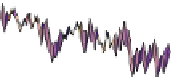
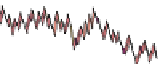
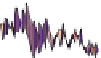
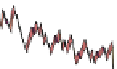
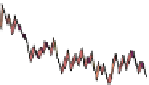
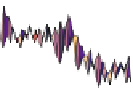
Fig. 12.26 Comparison of largest logarithmically transformed concentration values (base 10) in
experiment of Fig.
12.25
(Source: Agterberg
2007b
, Fig. 6)
Because
p
is small, most element concentration values after 14 iterations are
nearly equal to values that satisfy the original model of de Wijs. As illustrated in
Fig.
12.26
, exceptions are that the largest values, which include (1 +
d
)
14
316,
significantly exceed values that would be generated by the original model, which
include (1 +
d
0
)
14
¼
111. A similar effect would occur in the low-value tail. The
frequencies of very small values that are generated exceed those generated by the
ordinary model of de Wijs. Because the lowest concentration values cannot become
negative, they accumulate within an interval that is close to zero. When a logarith-
mic scale is used for value, the pattern that is expected would be similar to that
¼


Search WWH ::

Custom Search