Geoscience Reference
In-Depth Information
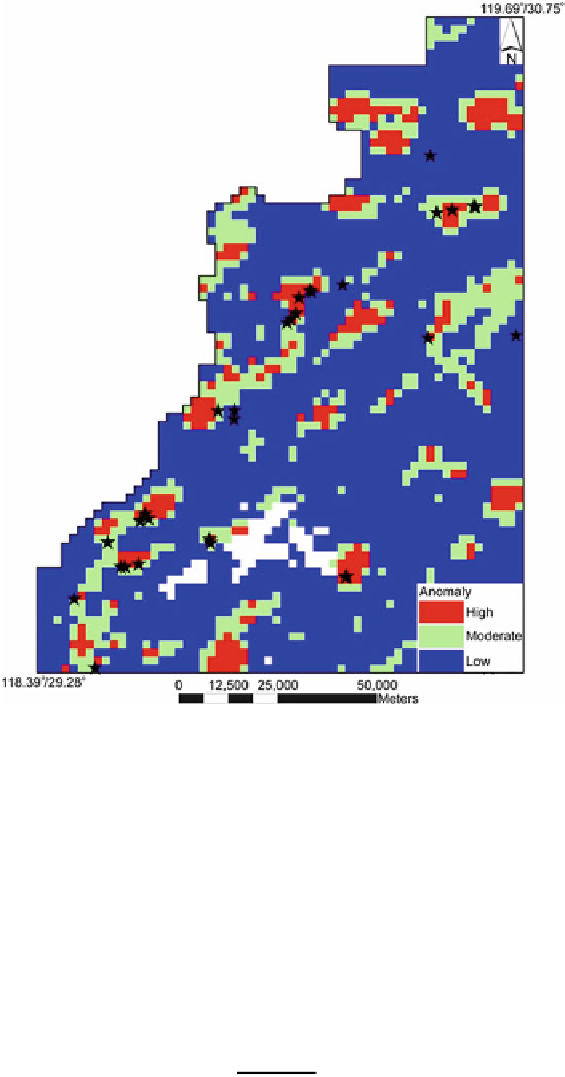
Fig. 11.28 Raster map for Fig.
11.27
showing target areas for prospecting for Ag and Pb-Zn
deposits delineated by comprehensive singularity anomaly method (cell size is 2
2 km). Known
Ag and Pb-Zn deposits are indicated by stars (Source: Xiao et al.
2012
, Fig. 13)
characterize the binomial/
p
model is the second order mass exponent
˄
(2)
¼
log
2
{
p
2
+(1
p
)
2
}. If the binomial/
p
model is satisfied, anyone of the param-
2
(log
e
x
) can be used for characterization. Using
different parameters can be helpful in finding significant departures from model
validity if these exist.
According to Chen et al. (
2007
) local scaling behaviour follows the following
power-law relationship:
eters
p
,
d
,
α
,
˄
(2),
α
min
,
α
max
,or
˃
g
¼
ʼ
f
B
x
ðÞ
g
ðÞʵ
α ðÞE
ˁ
f
B
x
ðÞ
¼
cx
E
E
Search WWH ::

Custom Search