Geoscience Reference
In-Depth Information
a
b
30 FT CONTOURS ON SPARKY SAND
30 FT CONTOURS ON SPARKY SAND
3000
200
2400
160
1600
120
1200
80
600
40
0
0
0
40
60
80
160
0
40
60
80
160
DIRECTION IN DEGREES
(CLOCKWISE FROM WEST = 0)
DIRECTION IN DEGREES
(CLOCKWISE FROM WEST = 0)
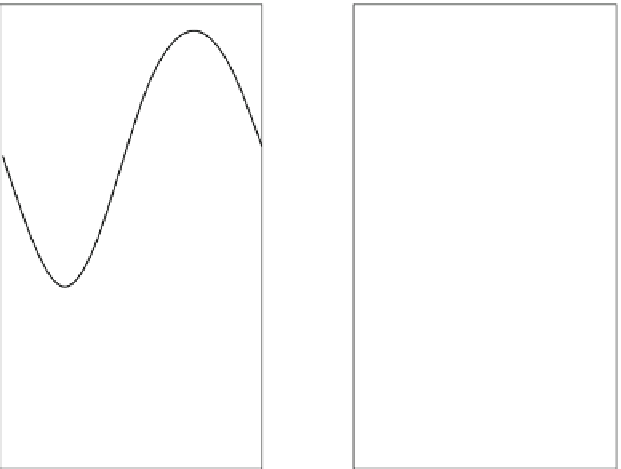
Fig. 1.13 Smoothed intercept and corresponding rose diagram for Fig.
1.12b
(Source: Agterberg
1980
, Fig. 5)
boundaries of map features. The input for this FORTRAN program consists of
intercept measurements which are smoothed for any direction
by replacing them
by values on successive parabolas each fitted by least squares to all intercepts
contained in the sector
α
+
ʲ
where
ʲ
is a search angle set equal to 30
to derive
Fig.
1.13a
. From each smoothed value
D
α
and the corresponding second derivative
of
D
α
with respect to
α
(
D
00
α
) which is also obtained from the fitted parabola, it is
possible to compute a frequency value (
α
ʔ
S
α
) of the rose diagram by using A-M.
(
D
α
+
D
00
Legendre's formula
ʔ
S
α
¼
)·
ʔα
(
cf
. Agterberg
1979b
) where
ʔα
is a
α
small angle set equal to 2
for the example shown in Fig.
1.13b
.
A result similar to Fig.
1.13b
could have been obtained by the more labori-
ous method of approximating the contours by many very short straight-line
segments and representing these straight-line segments in a rose diagram using
the method commonly applied for
the treatment of vectorial data and
lineaments.


Search WWH ::

Custom Search