Geoscience Reference
In-Depth Information
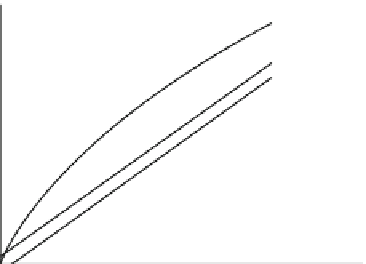
Fig. 11.21 Estimated
values of square root of
K
(
r
)/
ˀ
vs.
r
using Ripley's
edge effect correction and
showing departure from
complete spatial
randomness (CSR) model
(Source: Cheng and
Agterberg
1995
, Fig. 6)
20000
16000
12000
8000
4000
0
0
5000
10000
r
15000
20000
where
c
is a constant and
k
,
n
. Replacement of the second-order
difference by the second derivative (
cf
. Cheng and Agterberg
1995
, Eq. 20) results
in the simple approximate equation:
¼
1, 2,
...
D
2
r
˄ ðÞ
Kr
ðÞ
where
D
2
is another constant. Estimates of
K
(
r
) obtained by this approximate
equation were obtained by least squares after substituting
1.219 and are
shown in Fig.
11.22a
. In general, the preceding relationship in which
˄
(2)
¼
ʻ
2
is related
to the second-order difference provides a better approximation. Application of this
method resulted in the solid line on the log-log plot of Fig.
11.22b
. Clearly, both
methods provide satisfactory fits in this application. In a separate study Cheng
(
1994
) had shown that this multifractal approach also could be applied to the spatial
distribution of trees on a 19.6-acre square plot in Lansing Woods, Clinton, Mich-
igan, used by Diggle (
1983
) for testing other (non-fractal) statistical models for
point processes.
11.5 Local Singularity Analysis
In several recent studies, 2-dimensional applications of local singularity analysis
including regional studies based on stream sediment data show local minima that
are spatially correlated with known mineral deposits. These minimal singularities,
which may provide targets for further mineral exploration, generally are smoothed
out when traditional geostatistical contouring methods are used. Multifractal anal-
ysis based on the assumption of self-similarity predicts strong local continuity of
element concentration values that cannot be readily determined by conventional
semivariogram or correlogram analysis. This section is primarily concerned with


Search WWH ::

Custom Search