Geoscience Reference
In-Depth Information
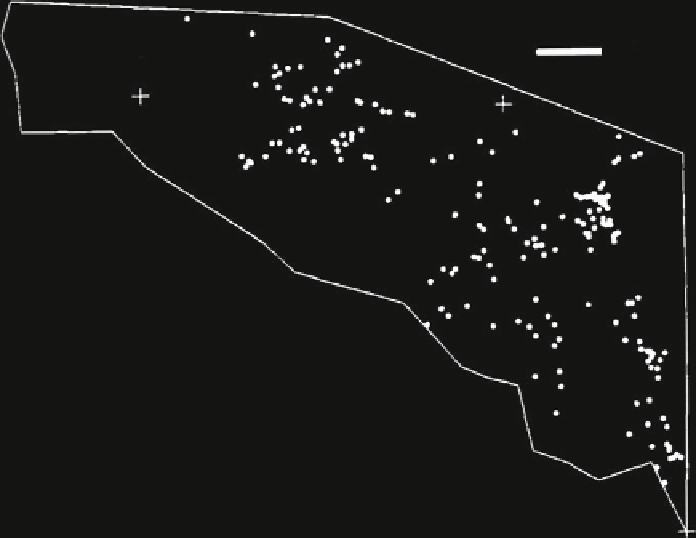
0
20 km
5620
130
30
N
5610
13000
Fig. 11.19 Gold mineral occurrences in Iskut River map sheet, northwestern British Columbia
(from B.C. Minfile Map 104B, 1989) (Source: Cheng and Agterberg
1995
, Fig. 4)
For spatial analysis, values of
K
(
r
) shown as circles in Fig.
11.21
were estimated
by using Ripley's edge effect correction that satisfies
X
I
i
r
ij
^
Kr
n
2
A
w
1
ij
ðÞ
¼
jj
i6
¼
j
Fig.
11.21
were estimated using the program CLUST (Agterberg
1994b
) to correct
for edge effects in a study area bounded by a polygon. Figure
11.21
is a special kind
of diagram with the property that a Poisson model for complete spatial randomness
(CSR) of points would plot as a straight line through the origin that dips 45
.
Ripley's (
1981
, p. 316) approximate 95 % confidence interval for the largest
difference between
ðÞ=ˀ
0
:
5
and
r
(CSR null hypothesis) is shown as well in
Fig.
11.21
. Clearly, the CSR model should be rejected.
Cheng (
1994
) and Cheng and Agterberg (
1995
) have developed a theoretical
multifractal model for 2-D point processes that is equivalent to the multifractal
^
Kr
Search WWH ::

Custom Search