Geoscience Reference
In-Depth Information
4.5
4
3.5
3
2.5
2
1.5
1
y = -2.06x + 3.7574
0.5
0
−
0.5
0
0.5 1
Log (Concentration Value)
1.5
2
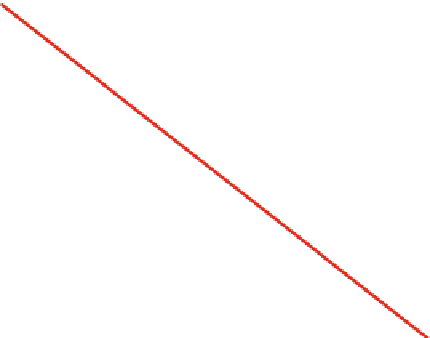
Fig. 10.25 C-A plot for Turcotte model with
d
¼0.4 and
N
¼14 (log base 10) (Source: Agterberg
2007
, Fig. 7)
4.5
4
3.5
3
2.5
2
1.5
1
−
0.5
−
0.3
−
0.1
0.1
0.3
0.5
0.7
0.9
1.1
1.3
1.5
Log (Concentration Value)
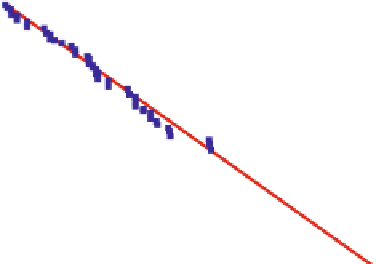
Fig. 10.26 C-A plot
for
logbinomial background with mean
ʼ
¼0.1 and
d
¼ 0.5 with
superimposed Turcotte anomalies with
ʼ
¼1.0 and
d
¼0.4 (log base 10) (Source: Agterberg
2007
, Fig. 8)


Search WWH ::

Custom Search