Geoscience Reference
In-Depth Information
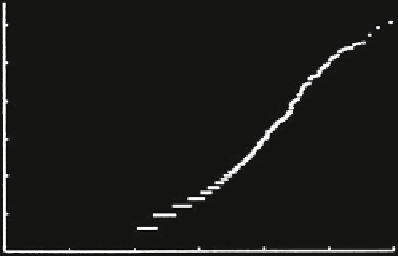
Fig. 10.19 Lognormal
Q
-
Q
plot of gold values (in ppb)
of stream sediment samples
at locations shown in
Fig.
10.18
. Secondary peak
at zero in (a) is for gold
values below detection limit
(Source: Cheng et al.
1996
,
Fig. 9b)
3.0
2.5
2.0
1.5
1.0
0.5
0.0
-3.0
-2.0
-1.0
0.0
1.0
2.0
3.0
Standard Normal Quantile
Fig. 10.20 Concentration-
Area (C-A) model for
Au. Areas were measured
on contour map of gold
values generated by Cheng
et al. (
1996
). Notice that
values fall on two distinct
straight-line segments, and
are interpreted as
background and anomaly
populations (Source: Cheng
et al.
1996
, Fig. 11)
10.4 Cascade Models
In a paper concerned with multifractal measures for the geoscientist, assuming that
ore tonnage is equivalent to volume, Mandelbrot (
1989
) uses the model of de Wijs
(
1951
) as a starting point for spatial distribution of metals in the Earth and
concludes that the zinc ore “curdled” into a multifractal. The model of de Wijs
will be taken as a starting point in this section. In general, it leads to lognormal
distribution of metal concentrations without Pareto tails and modifications of the
approach will be needed to explain separate straight-line segments commonly
resulting from applications of the C-A method.
The model of de Wijs is a simple example of a binomial multiplicative cascade
(
cf
.Mandelbrot
1989
). The theory of cascades has been developed extensively
over the past 25 years by Lovejoy and Schertzer (
1991
) and Schertzer et al. (
1997
)
and other geophysicists, particularly in connection with cloud formation and rainfall
(Schertzer and Lovejoy
1987
; Over and Gupta
1996
; Veneziano and Furcolo
2003
;
Veneziano and Langousis
2005
). More recently, multifractal modeling of solid-Earth

Search WWH ::

Custom Search