Geoscience Reference
In-Depth Information
a
b
1.4
1.2
1.0
0.8
0.6
0.4
0.2
0.0
1.2
1.0
0.8
0.6
0.4
0.2
0.0
y=-10.656x+1.2927
y=-0.4062x+1.5123
-0.2
0.00 0.02 0.04 0.06 0.08
10
0.10 0.12
0.14 0.16
1.0
1.5
2.0
2.5
3.0
3.5
10
Log (t)
Log (t)
c
1.6
1.4
1.2
1.0
0.8
0.6
0.4
0.2
0.0
y=-0.8005x+4.1342
3.0
3.5
4.0
4.5
5.0
5.5
10
Log (t)
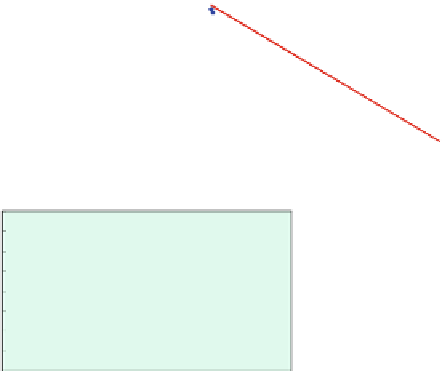
Fig. 10.16 Log-log plots of rank versus metal tonnage for the three types of deposits; the straight
lines were fitted to the largest deposits only and represent Pareto distributions (Source: Agterberg
2013
, Fig. 7)
estimates. The slopes in the log rank versus log tonnage plots are
10.66,
0.406
and
0.801 for podiform Cr, volcanogenic massive sulphide and porphyry copper
deposits, respectively.
10.3 Geochemical Anomalies Versus Background
The main method to be considered in this section is the Concentration-Area (C-A)
method, which is based on the fact that log-log plots of element concentration value
versus cumulative area often show patterns that can be described by two consecutive
straight-line segments (
cf
.Fig.
10.6
). These may correspond to anomaly and
background, respectively. There are situations, however, that a pattern consists of
more than two straight-line segments, or that a curvilinear pattern provides a better fit.
The C-A method was originally proposed by Cheng (
1994
) and also is described with
applications in Cheng et al. (
1994
).
In addition to the C-A method, several other methods for non-linear spatial
information extraction have been developed during the past 10 years to aid in the
analysis of regional geochemical and geophysical map data (Cheng
1999
). These
methods, which will not be discussed here, include integrated spatial and spectral
analysis for geochemical anomaly separation (Cheng et al.
2001
), eigenvalue-
eigenvector analysis of multifractal fields (Li and Cheng
2004
; Cheng
2005
), and


Search WWH ::

Custom Search