Geoscience Reference
In-Depth Information
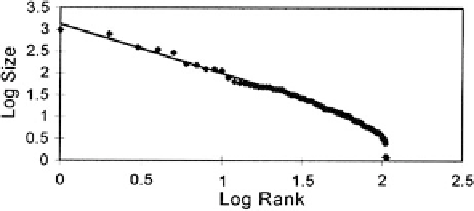
Fig. 10.10 Production and reserves of 107 lode gold deposits (in metric tons Au) in Abitibi
volcanic belt, Superior Province, Canadian Shield, ranked according to their sizes (largest deposit
first). Pareto distribution fitted as straight line (Source: Agterberg
1995a
, Fig. 2)
The simple method of checking whether or not a set of resource estimates
satisfies a Pareto distribution introduced in Chap.
4
consists of constructing a
log-log plot of amount of metal per deposit and size rank (in descending order).
In Fig.
10.10
this method is applied to gold deposits in the Abitibi volcanic belt. If
the Pareto model is satisfied, this type of plot produces a straight line, usually with a
relatively sharp downward bend at the end because of an economic cut-off effect.
Although lognormal and Pareto distributions commonly are fitted to metal from ore
deposits in large regions or on a worldwide basis, it should be kept in mind that
metal from ore deposits in smaller regions can have different frequency distribu-
tions. The Vistelius model that combining lognormal distributions from smaller
regions or different rock units can produce a new lognormal distribution with
for the Abitibi volcanic belt, it is shown in Agterberg (
1995b
) that 53 lode gold
deposits from the Superior Province on the Canadian Shield but from outside the
Abitibi volcanic belt satisfy a different Pareto distribution.
10.2
2-D Distribution Patterns of Mineral Deposits
Point patterns can be fractal (Feder
1988
; Stoyan et al.
1987
; Korvin
1992
). In
general, fractal point patterns are characterized by the fact that average point
density (
number of points per unit of area) decreases when size of study area is
increased. In this respect, fractal point patterns differ from commonly used statis-
tical point-process models such as the random Poisson and various clustering
models in which the mean point density is assumed to be the same within the entire
study area regardless of its size. Mathematical statisticians (Ripley
1976
,
1981
,
1987
,
1988
; Diggle
1983
; Rowlingson and Diggle
1991
,
1993
; Cressie
2001
;
Baddeley and Turner
2012
; Baddeley et al.
2006
; Baddeley et al.
2008
) have
developed very precise methods to estimate the parameters of constant-density
pattern parameters for edge effects was applied to wildcats and gas discoveries in
¼
Search WWH ::

Custom Search