Geoscience Reference
In-Depth Information
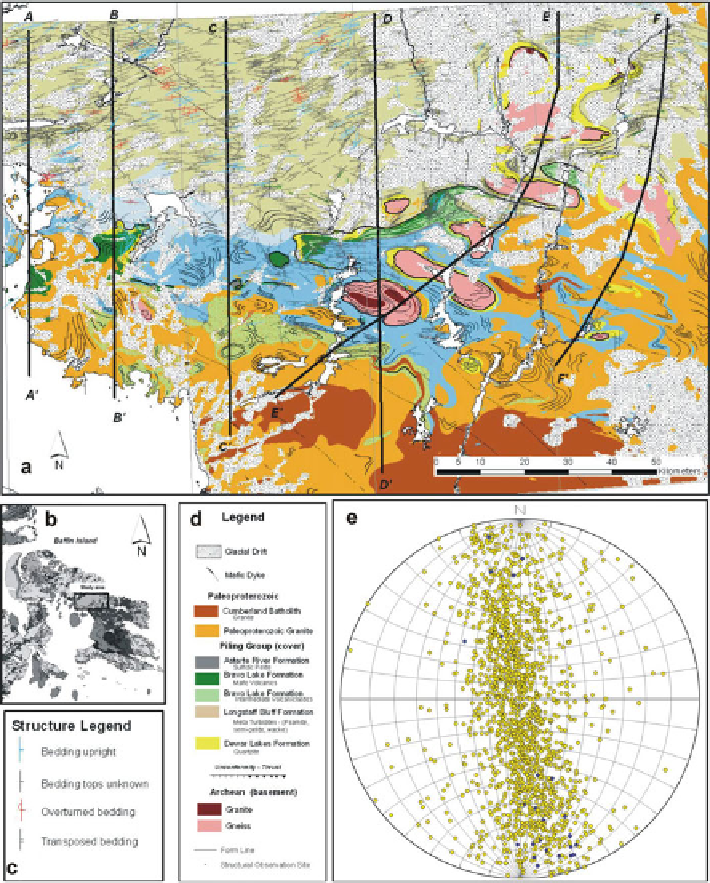
Fig. 1.7 Central Baffin region used for 3-D modeling example in Fig.
1.8
.(a) Map of the Central
Baffin region contains 1,774 structural measurements (tablets) taken at surface from supracrustal
rocks (St-Onge et al.
2005
). The region is approximately 150 km East-west by 100 km North-south
(Note scale for context of 3-D images). (b) Reference map. (c) Structural legend for supracrustal
bedding observations. (d) Stratigraphic legend accompanying map (a). (e) All poles for 1,774
supracrustal dip measurements were used in Structural Field Interpolation (Note shallow near
East-west rotation axis for these bedding poles).
Yellow
poles are upright,
blue
poles are
overturned (Source: Hillier et al.
2013
, Fig. 8)
Search WWH ::

Custom Search