Geoscience Reference
In-Depth Information
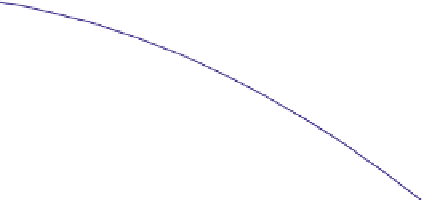
Lognormal on log-log paper
18
16
14
12
10
8
6
4
2
0
0
1
2
3
4
5
6
7
8
Log10 (Amount of Metal)
Fig. 10.8 Hypothetical lognormal distribution (
blue curve
) plotted on log-log paper (log base 10).
Straight line tangent to lognormal curve represents Pareto distribution (
pink line
) (Source:
Agterberg
2007
, Fig. 1a)
for Cu and
D
AL
¼
2.07 for As). For Au, the estimated value of
D
AL
(1.48) is significantly greater than the estimated structural fractal dimension (1.24).
From the relation
D
A
¼
1.28 and
D
A
¼
1.68 for gold which is less
than 2. These results indicate that the distribution of Au in the alteration zones is
more irregular than that of Cu or As.
2D
L
/
D
AL
, it follows that
D
A
¼
10.1.3 Total Metal Content of Mineral Deposits:
Abitibi Lode Gold Deposit Example
The problem of whether natural resources are best modeled as Pareto- or
lognormal-type remains important because both approaches continue to be used
extensively for oil and other natural resource size-frequency modeling. As men-
by asserting that oil and other natural resources have Pareto distributions and this
“finding disagrees with the dominant opinion, that the quantities in question are
lognormally distributed. The difference is extremely significant, the reserves being
The difference between the two types of frequency distribution is illustrated in
Figs.
10.8
and
10.9
using an artificial example for amount of metal contained in all
ore deposits from a region. The distribution that plots as a straight line on one kind
of diagram plots as a curve on the other diagram. The Pareto not only has a thicker
tail, it deviates more strongly from the lognormal at the other (lower value) end,


Search WWH ::

Custom Search