Geoscience Reference
In-Depth Information
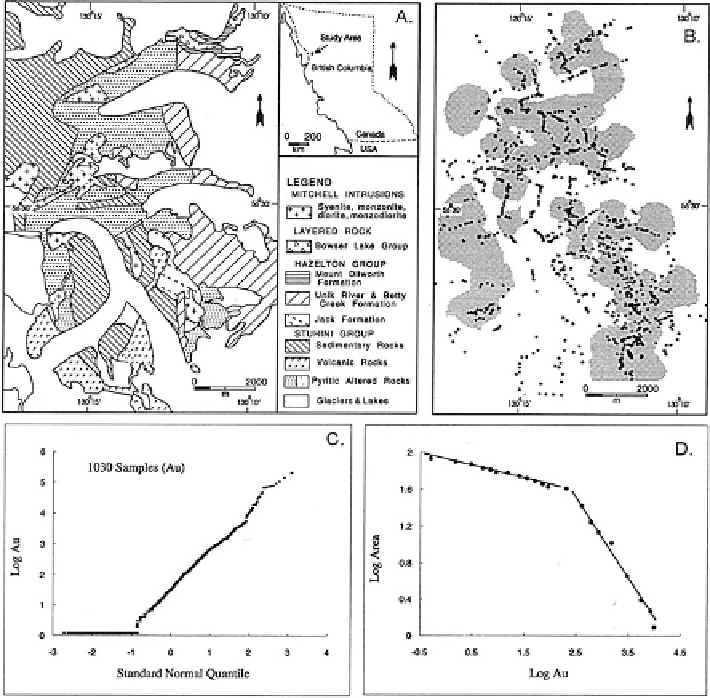
Fig. 10.4 Mitchell-Sulphurets mineral district, northwestern British Columbia. Four plots origi-
nally constructed by Cheng (
1994
): (a) Simplified geology after R.V. Kirkham (personal commu-
nication, 1993), including outline of alteration zones; (b) Sampling sites and (smoothed) isopleth
for 200 ppb gold concentration value; (c) Lognormal
Q
-
Q
plot (Au determinations below 2 ppb
detection limit are shown as horizontal line); (d) Log-log plot for area enclosed by isopleths
(including circumference of pattern for 200 ppb in Fig. 10.4b). Straight lines are least-squares fits
(log base 10; gold in ppb) (Source: Agterberg
1995a
, Fig. 3)
The Geographic Information System (GIS) used to obtain the contour maps of
Fig.
10.5
(“Spatial Analysis System” or SPANS;
cf
. Cheng
1994
) allowed several
interpolation procedures, including 2-D Kriging and so-called “potential mapping”.
The latter method consisted of the calculation of simple weighted moving averages
with a moving circular window with adjustable parameters to control the weighting
the circular window, decay ratio of the weighting function, and maximum number
of samples to be included within each window. For the example (
cf
. Cheng
et al.
1994
) parameters selected were: radius of 0.8 km, decay ratio of 0.5
(corresponding to a linear weighting function with weight 0 for samples located
Search WWH ::

Custom Search