Geoscience Reference
In-Depth Information
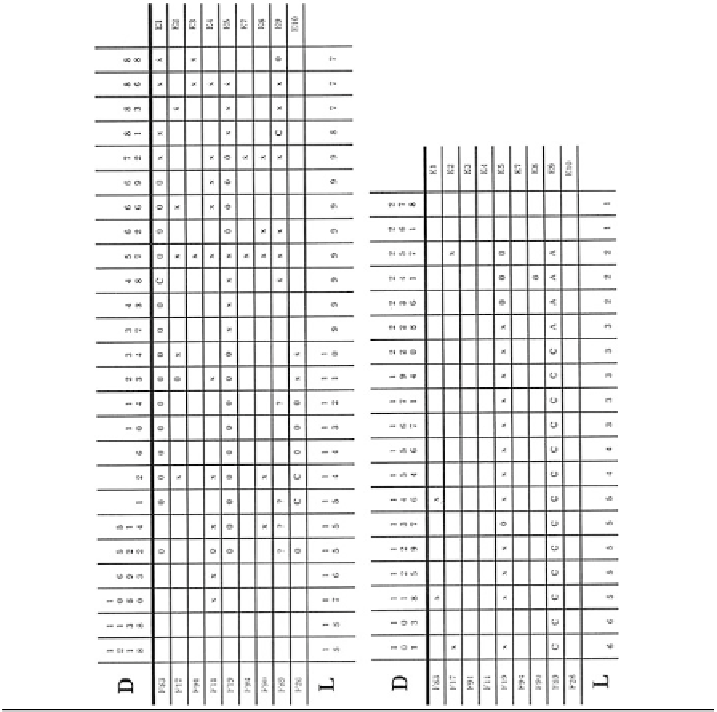
Table 9.8 Stratigraphic distribution of nine taxa of fossil nannoplankton for individual core
samples in the Media Agua Creek area, Kern County, California (according to Sullivan
1964
,
Table 3, and Sullivan
1965
, Table 6)
Source: Agterberg (
1990
, Table 4.4)
Stratigraphic distance (D) in feet was measured upward and downward from the “Tejon” Forma-
tion; Paleocene-Eocene boundary occurs between 103 and 118 ft. Fossil (F) numbers in first
column are as in Table
9.6
. A-abundant, C-common, 0-few, x-rare. Single bar indicates strati-
graphic events E1 to E10 used in Table
9.5
and Fig.
9.3
(as defined for core samples extending up
to 88 ft below the “Tejon” Formation); relative superpositional relations (as shown in Fig.
9.2
)
would be changed if lowest occurrences of four taxa in Paleocene shown in lower part of this table
were used. Level (L) as in Guex (
1987
, p. 228)
involving the event W, which occurs at or near the top of all (nine) sections (labeled
A to I in Fig.
9.6
) are statistically significant for this level of significance. This
binomial test has the drawback that it can consider pairs of events only. A multi-
variate approach as followed in RASC is more appropriate. This is illustrated in
Fig.
9.9
for some of the events in the Hay example.

Search WWH ::

Custom Search