Geoscience Reference
In-Depth Information
10,600 FT
SURFACE
25
100
50
50
10,200 FT
100
14,200 E
14,600 E
15,000 E
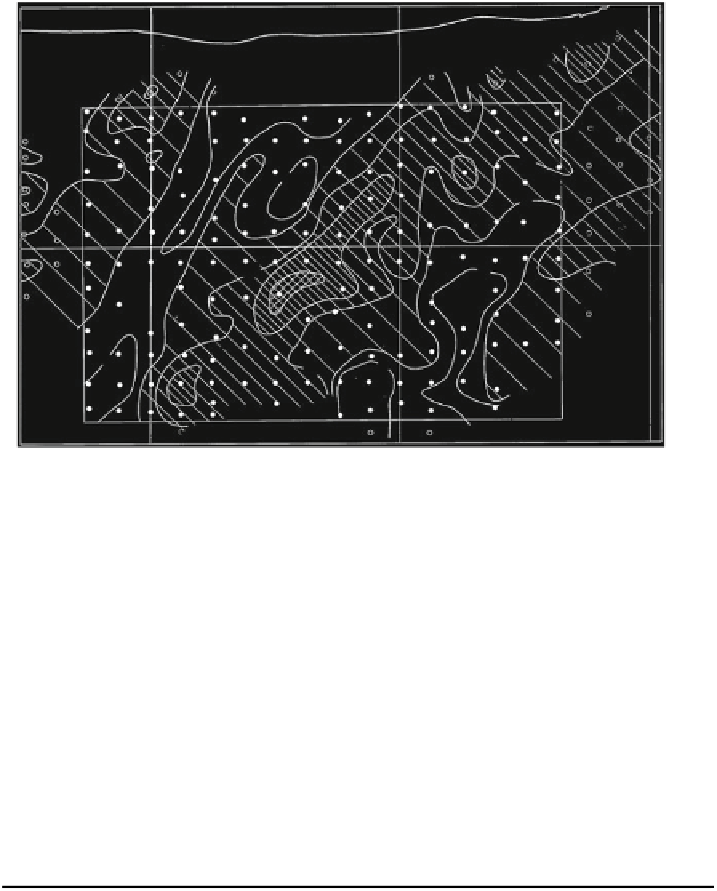
Fig. 7.28 Manually contoured map of percent-foot values for copper in longitudinal section
across Whalesback deposit, Newfoundland. Each
dot
represents the approximate intersection
point of an underground borehole with the center of the mineralized zone (Source: Agterberg
1974
, Fig. 47)
Table 7.4 Matrix of underground drill-hole data for area depicted in Fig.
7.28
29
146 116 76
22
6
(23)
11
18
48
60
94
9
32
137 128
51
47
91
(60) 12
21
43
32
40
52
158 139
94
77
118 77
43
60
94
34
19
67
31
22
65
112 126 78
258 80
(86) 110
91
(70) 60
34
66
29
(41)
32
164 286 160 (126)
(97)
(97) 74
70
91
73
68
21
75
44
35
73
297 89
140 52
66
49
52
43
105 43
36
42
40
77
83
272
209 107 177 40
29
42
52
199
66
32
(47) 58
128 114
354
(194) 284 169 (91) 25
(34) 9
(61) 27
47
(38) 31
86
76
(159)
(150) 113
43
78
(69) 40
21
64
(51) 35
41
8
41
125 196 128
118
74
76
33
70
65
29
64
100 57
19
19
62
260 135 174
135
163
23
18
33
24
36
95
(67)
(78)
20
35
59
168 199 (146) 91
(85)
16
13
58
30
(40) 23
(59)
(68)
Source: Agterberg (
1974
, Table XXVIII)
Values represent products of horizontal width of orebody (in feet) and average concentration value
of copper (in percent)
the pattern of Fig.
7.28
. In fact, conventional analysis of variance indicated that the
linear (
R
2
0.16) and quadratic (
R
2
0.32) fits were not statistically significant.
Agterberg (
1969
) fitted the function
X
(
p
,
q
;
u
,
v
) (see Box
7.2
) by least squares
to estimate the coefficients
b
1
¼
¼
¼
Im (
A
p,q
) for many possible
directions of axes and periods for the waves. Ideally, a least-squares model should
have been used by which the four parameters (direction of axis, period, amplitude
Re (
A
p,q
) and
b
2
¼

Search WWH ::

Custom Search