Geoscience Reference
In-Depth Information
0
50
100
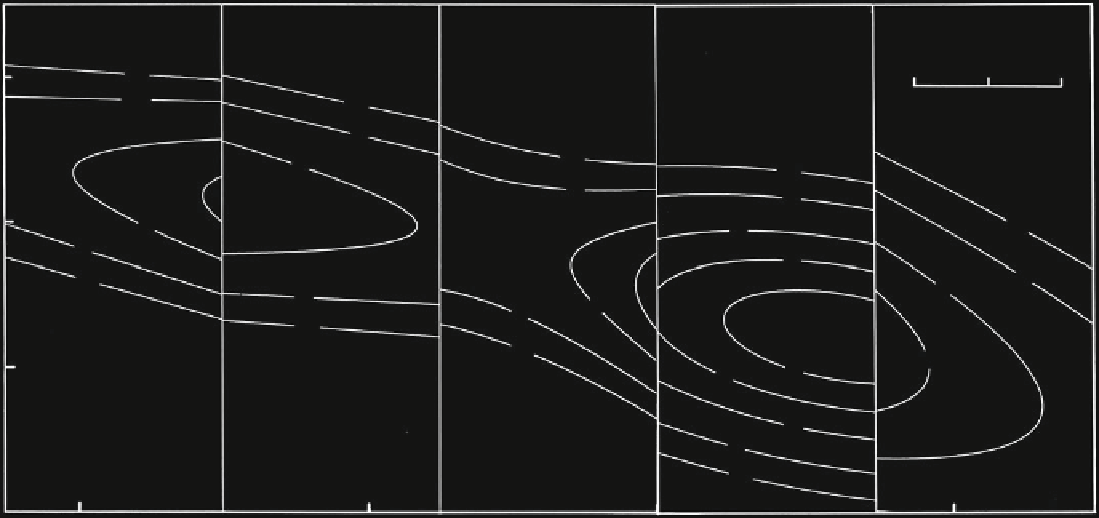
13500N
FEET
13400N
1.0
0.25
13300N
13200N
14000E
14200E
14400E
14600E
Fig. 7.8 Mosaic of exponential quadratic trend surfaces for copper concentration value on the 425-ft. level of Whalesback Mine; based on underground borehole
data; drill-holes were north-south oriented, approximately 50 ft. apart; western boundary coincides with drill-hole No. 2 (Source: Agterberg
1974
, Fig. 48)
Search WWH ::

Custom Search