Geoscience Reference
In-Depth Information
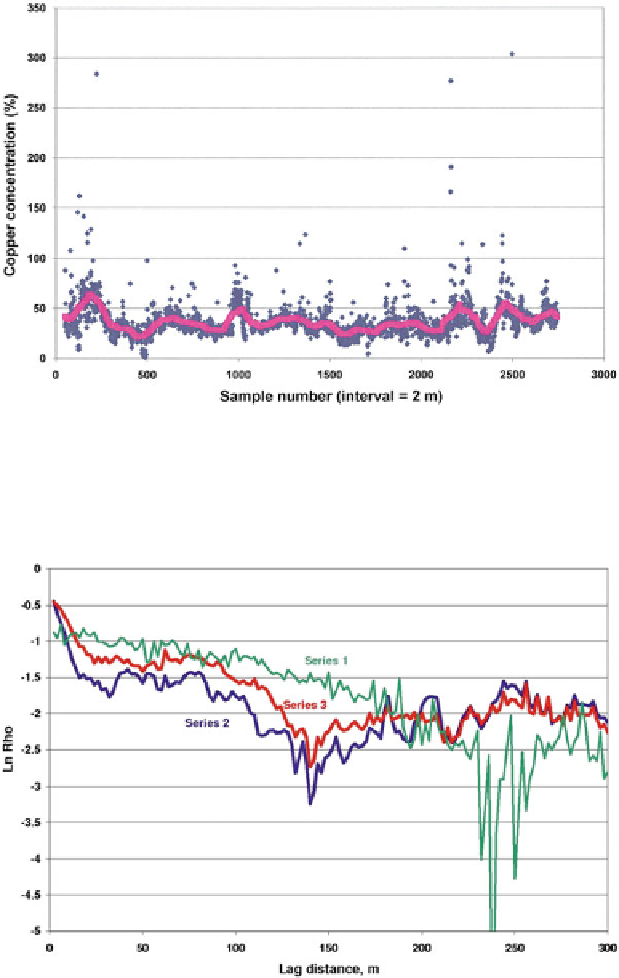
Fig. 6.22 Copper concentration (ppm) values from Main KTB bore-hole together with mean
values for 101 m long segments of drill-core. Locally, the original data deviate strongly from the
moving average (Source: Agterberg
2012
, Fig. 15)
Fig. 6.23 Correlograms for three consecutive series of copper concentration values from Main
KTB bore-hole. Series 2 (for depths between 2 and 4 km) and Series 3 (for depths between 4 and
5.54 km) show similar autocorrelations that differ from autocorrelation function for Series 1
(for depths between 0.05 and 2 km) (Source: Agterberg
2012
, Fig. 16)
Search WWH ::

Custom Search