Geoscience Reference
In-Depth Information
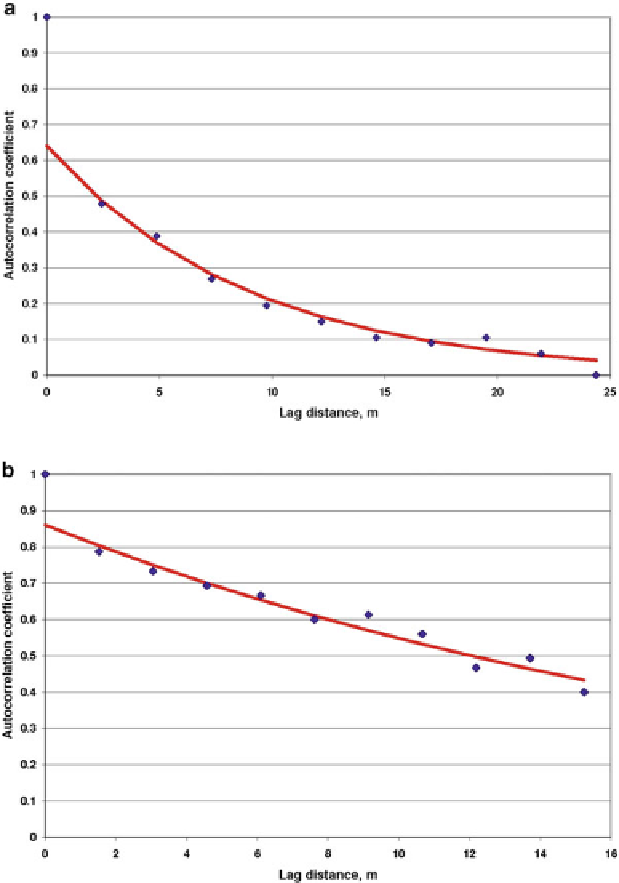
Fig. 6.16 Estimated autocorrelation coefficients and best-fitting negative exponential autocorre-
lation functions (
curves
) derived from logarithmically transformed element concentration values:
(a) Average correlograms for 24 copper channel sample series from drifts at various levels of
Whalesback copper deposit, Newfoundland (After Agterberg
1974
); (b) Series of 462 gold assays
from the Orange Free State Mine, Witwatersrand goldfields, South Africa (Modified from Krige
et al.
1969
); (c) Other series with 540 values from same gold mine. In each diagram the fitted
exponential intersects the vertical axis at a point with autocorrelation coefficient less than 1
indicating existence of “nugget” effect (From Agterberg
2012
, Fig. 6)
Search WWH ::

Custom Search