Geoscience Reference
In-Depth Information
0.5
0.5
0.4
0.4
SILT
CLAY
0.3
0.3
0.2
0.2
0.1
0.1
200 100
PERIOD IN YEARS
66.7
50
200
100
66.7
50
Fig. 6.11 Theoretical power spectra corresponding to theoretical autocorrelation functions of
Figs.
6.7
and
6.8
.
Crosses
denote smoothed theoretical power density values for frequency bands
using the hanning response function. Observed values (o) from Fig.
6.10
are also shown and can be
compared to crosses (Source: Agterberg and Banerjee
1969
, Fig. 13)
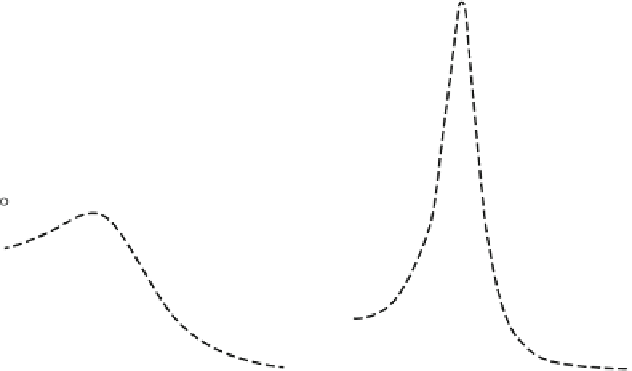
Fig. 6.12 Theoretical
phase angle for clay and silt
according to which the
response
h
(
t
) lags behind
the random process
ʷ
(
t
).
Note that the clay leads the
silt for
T>
130 years where
most of the power density
occurs according to
Fig.
6.11
(Source:
Agterberg and Banerjee
1969
, Fig. 14)
Summarizing it can be concluded that the non-random thickness pattern of
varves in Lake Barlow-Ojibway primarily consists of an exponential decrease
away from the retreating ice front. In individual sections this decrease shows as
gradual thickness decreases in both silt and clay. Elimination of this overall trend


Search WWH ::

Custom Search