Geoscience Reference
In-Depth Information
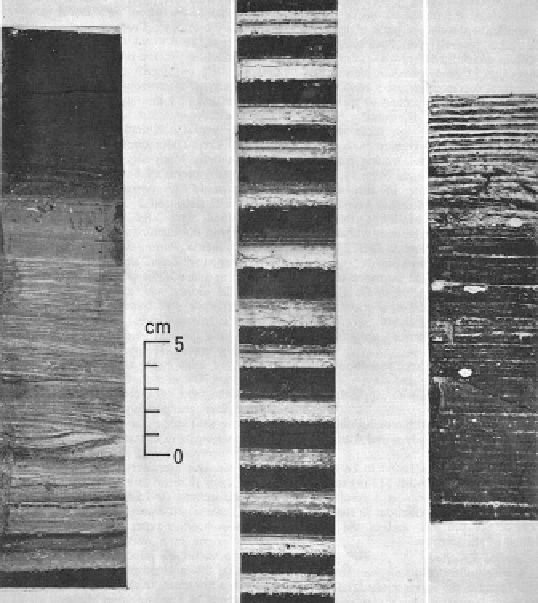
Fig. 6.2 Typical examples of the three facies of varves (from
left
to
right
: sandy, silty and
diamictic facies) (Source: Agterberg and Banerjee
1969
, Fig. 4)
vertical sequence too, individual varves were successively overlain by more distal
facies as the ice-front and with it the proximal end of the varves receded northward
with time. Kuenen (
1951
) proposed a mechanism of varve deposition by annual
turbidity currents with silt deposition during the summer followed by slow clay
deposition during the winter.
In total, 4,310 thickness measurements from eight sections (locations shown in
Fig.
6.1
) were statistically analyzed. In the longest series (No. 4 with 537 silt-clay
couplets), silt layers near the bottom are about ten times as thick as those near the top.
The clay layers near the top are about three times thinner than those near the bottom. A
logarithmic transformation was desirable in order to ensure that variations in thickness
are of the same magnitude in parts of the series that are relatively thick and relatively
thin, respectively. For example, the sum of squared silt thickness data on which
measures of variability such as the variance are based, amounts to 1,037.2 cm
2
for
series 4. The first 100 values in this series contribute 91.99 % and the last 100 values
only 0.02 % to this total sum of squares that is based on all 537 data. If no logarithmic
transformation would be applied to the observations, results from a statistical study
would be largely determined by variations in the thicker parts of the series, whereas
variations in the thinner parts of the series would have a negligibly small effect on the
Search WWH ::

Custom Search